2.3. Main Window
The main window is a desktop window that contains all simulation GUI window
such as the Simulation List, the Simulation Control, the Simulation Setting,
the Vertical Projection of Forest, etc. Some windows might show up outside
the SExI-FS desktop (ex. 3D Visualization window). The main window contains
a menu bar to interact and work with the system.
Figure 8: Main Window.
Figure 9: Menu Bar, Pull Down Menu, and Title Bar Description
2.3.1. File Menu
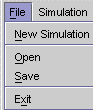
Figure 10: File Menu
The File menu has submenus for interacting with input and output file:
- New Simulation
Select this option to create new simulation.
- Open
Select this option to load the simulation file produced by SExI-FS
- Save
Select this option to save the selected simulation on the Simulation List
window.
- Exit
Select this option to quit SExI-FS.
2.3.2. Simulation Menu
Figure 11: Simulation Menu
The Simulation menu is a tool for working with the simulations. It’s
connected to an active simulation (highlighted) on the Simulation List window.
You can access a similar menu by right clicking the mouse when the pointer
is on the highlighted item in the simulation list. Below are the submenus:
- Setting
This will show the Simulation Setting window.
- Start
Select this option to start simulation. Be sure to set the simulation time
in the Simulation Control window before running the simulation.
- Stop
Select this option to stop simulation.
- Vertical Projection
Select this option to open the Vertical Projection View of the tree stand.
- 3D View
Select this option to open the 3D Visualization of the tree stand.
- Data
Select this option to show the statistical chart of the simulation data.
The available types of chart are:
- Scatter plot
A scatter plot or scatter graph is a graph used in statistics to visually
display and compare two sets of related quantitative, or numerical,
data by displaying only finitely many points, each having a coordinate
on a horizontal and a vertical axis.
- Line chart
A line chart is a graphic representation of quantitative information
by means of a chart in which a series of data points are connected
by a continuous line.
- Bar chart
A bar chart is a chart with rectangular bars of lengths usually proportional
to the magnitudes or frequencies of what they represent.
- Export Data
Here you can export the data for further analysis using other statistical
software. This will export the data on TXT file format with tab separated
row data.
- Remove
This option will remove the selected simulation
2.3.3. Statistic Chart Menu
Figure 12: Statistic Chart Menu
This Statistical Chart Menu is applied for the whole simulation data on the
Simulation List window. It has the following menu items:
2.3.4. Window Menu
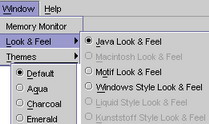
Figure 13: Window Menu
This is an optional menu for window setting and controlling the system:
- Memory Monitor
This option will show the memory allocation used by this system over time
dynamically.
- Look and Feel
This option will change the graphic appearance of the software. There are
six options of Look and Feel: Java, Macintosh, Motif, Windows, Liquid,
and Kunststoff style. The available styles are Java, Motif, and Windows
style. The Java style is the default look and feel.
Look and feel refers to design aspects of a graphical user interface - in
terms of shapes, layout, typefaces, etc (the "look"); and, the
behavior of dynamic elements such as buttons, boxes, and menus (the "feel").
It is used in reference to both software and websites.
- Themes
This option is an additional menu to the Look and Feel menu. If you choose
the default Java look and feel, then the available options are Default,
Aqua, Charcoal and Emerald. This selection will change appearance color
of the application such as the background color, pointer color, etc.
2.3.5. Help Menu
In Help menu, you can see help SExI and about SExI-FS version.
2.3.6. Simulation List Window
Simulation List window is the simulations holder. It contains the list of
active simulations in the system. The window displays current status of each
simulation such as the simulation progress, age, and population of the trees.
The Auto Run option allows you to run a series of simulations in a batch mode.
Double click on one of simulation line, and the Simulation Control window will
show up.
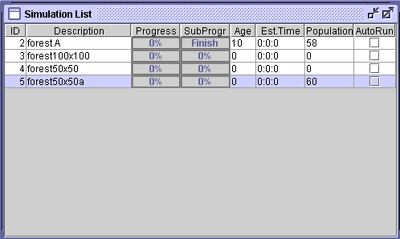
Figure 14: Simulation List Window.
2.3.7. Simulation Control Window
Figure 15: Simulation Control Window
This window displays the status and control buttons of the current simulation
-
 Setting: click this
button to open Simulation Setting window.
Setting: click this
button to open Simulation Setting window.
-
 Start: click this
button to start simulation.
Start: click this
button to start simulation.
-
 Stop: click this
button to stop simulation.
Stop: click this
button to stop simulation.
 Vertical Projection:
click this button to open Vertical View window.
Vertical Projection:
click this button to open Vertical View window.-
 3D View: click this
button to open the Forest 3D Viewer window.
3D View: click this
button to open the Forest 3D Viewer window.
-
 Statistic Chart:
click this button to open the Statistic Chart window.
Statistic Chart:
click this button to open the Statistic Chart window.
2.3.8. Vertical View Window
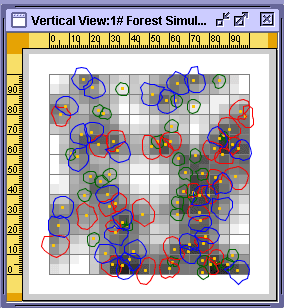
Figure 16: Vertical View Window
This window displays the plot of trees stand in vertical projection. You can
see a popup menu on this window by right clicking in this window. There are
two group of popup menu in this panel: Plot Menu and Tree Menu. The Plot Menu
will show up if you right click in the planting area, but if you select the
tree then do the right click, then the Tree Menu will show up. The Plot menu
has some options to interact with the plot and to change its appearance:
- Paint
Select this option to change the drawing mode of crown shape projection either
in outline, opaque, transparent, or shading mode. See 4.1.1: Tree Paint
for more information.
- Show
Select this option to view tree’s info, like ID, Label, CP, and CF.
See 4.1.2,
- Overlay Map
Select this option to see the overlay map. See Overlay Map for more information.
- Zoom In
Select this option to examine closely the stand.
- Zoom Out
Select this option to have a wider view of the stand.
Figure 17: Global Menu
Tree menu group has some control menus for the selected trees:
- Horizontal View
Select this option to view the trees from north, east, south, or west projection.
- Hemiphot
Select this option to view the hemispherical photograph of the canopy gap
on the selected tree position. See chapter 4.6: Hemispherical Photograph
for further information.
- Remove
Select this option to view the hemispherical photograph of the canopy gap
on the selected tree position. See chapter 4.1.4: Cut the Trees for further
information
- Show 3D
Select this option to view the selected trees in 3D visualization. See chapter
4.4: View 3D Animation for further information
- Tree Stat
Select this option to see the statistic chart of the selected tree individually.
- Object Inspector
Select this option to view the tree’s properties. See 4.1.5: Tree’s
Object Inspector for more information.
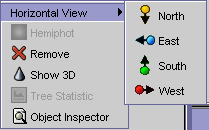
Figure 18: Tree's Menu
2.3.9. Trees 3D Visualization
This window displays the 3D visualization of the trees. Optionally, the crown
can be shown in solid or wire frame mode. The detail of the tree menu will
be discussed in View 3D Animation section
2.3.10. Forest 3D Visualization
This window displays the 3D visualization of the whole trees. You can view
it from any direction interactively. In this panel, you can set the crown to
be rendered in leafy, solid, or wire frame mode. You can set also the land
to be rendered in wire frame or solid mode. For further information, see in
4.3: View 3D .
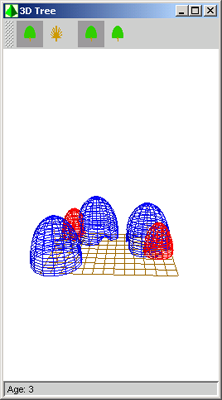
Figure 19: Forest 3D visualization
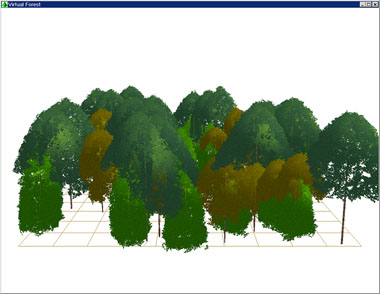
Figure 20: Trees 3D visualization