West Africa Drylands Project
Ecosystems Approach to Restoring West Africa Drylands
At the pilot sites, UNEP, ICRAF and the University of Florida's Center for Environmental Policy will support national programmes, local development institutions and village communities to introduce community land use planning and agroforestry-based conservation practices.
Land Degradation Surveillance
The first
component, land degradation surveillance is a set of new tools for diagnosing
land degradation problems and soil constraints over large areas.
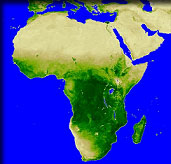
The first step is the use time series analysis of vegetation dynamics
from low resolution satellite data, which is used to identify areas of
potential land degradation or recovery.
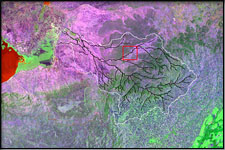
Next, moderate resolution imagery (e.g. MODIS) is used to target degraded
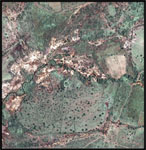
areas in more detail. We then zoom in further to areas of interest using
high resolution imagery (here QuickBird imagery with a spatial resolution
of 0.6 m) which allows erosion features and even individual trees to be
identified.
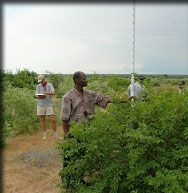
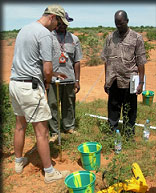
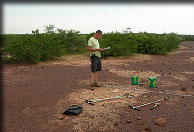
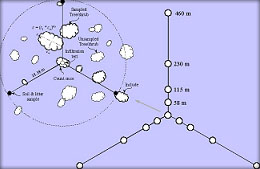
Photo: systematic geo-referenced ground survey
Within these areas, systematic geo-referenced ground survey is conducted
to acquire data on biophysical and socio-economic processes. Vegetation
is characterized and soil samples taken.
New remote sensing techniques in the laboratory are used to rapidly characterize
large numbers of soil samples. From soil spectral signatures, soil properties
are estimated for hundreds of geroreferenced ground points in a region.
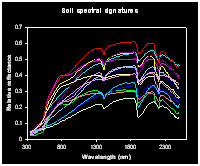
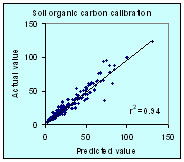
Figure: Soil specral signatures and carbon calibrations
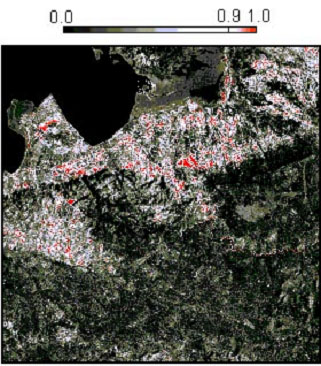
Land Degradation Surveillance - Prevalence mapping
By calibrating this ground data to the satellite
imagery, prevalence of land degradation problems and soil constraints
can be mapped out with known accuracy.
| Prevalence estimates (95% confidence limits) of soil
physical degradation in the River Nyando basin (3,500 km2): Area of the basin affected: Rill erosion: 16.5–29.8% Soil hard-setting: 5–13.4% Gully erosion: 7.8–17.7% Severe soil physical degradation: 36.9–49.1% |
In this example, the prevalence of gully erosion in the Nyando River Basin in Kenya is estimated with 95% confidence limits of 8 to 18%. The map on the left shows in red areas with a high probability of accelerated erosion, which should be targeted for rehabilitation. White areas show early signs of erosion where it may not be too late to take preventative measures. A major thrust of the project is to build national capacity in the application of these new tools at regional scales in concert with environmental accounting.
Copyright © 2008, West Africa Drylands Project. All rights reserved