Measurement and Monitoring Soil Carbon
Presentation and use of results
Presenting
the results is straightforward. The estimates and maps can be presented in
obvious ways. They should always be accompanied by estimates of error (see
Figure 1). They should also be accompanied by a detailed description of the
methods used, for example by reference to this protocol. Note that every part
of the process needs to be described, not just the statistical, sampling or lab
procedures. It is good practice to lodge all data from the exercise in a public
archive. This allows the project keep data secure for follow up and allows
others to make use of it for further analyses and to link it with other data.
Suitable archives are at (AfSIS) or the project can
make its own, for example in Dataverse (http://thedata.org/).
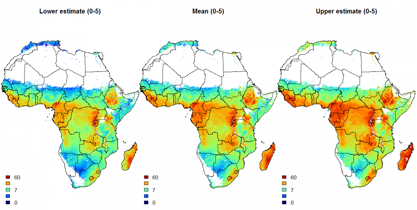
Figure 1. Prediction
maps of the lower limit, mean and upper limit (90%
prediction interval) for organic carbon (permille)
for the first standard depth (0-5 cm). White pixels indicate areas without any
vegetation cover that have been masked out from the mapping.
Reporting
It
is good practice to conduct key category assessments for each land use
category using the guidance provided in this chapter and in Chapter 5 Section
5.4:
• Within each land use category designated as key, to assess which
subcategories are significant; and
• Use the results of this analysis to determine what categories and
subcategories should be prioritized in terms of
methodological choice.
Reporting
categories are divided into greenhouse gases and land uses i.e., lands
remaining in a use and lands converted to that use. Category estimates are a
compilation of individual subcategories. Table 3.1.3 shows the subcategories
within each reporting category. The reporting tables are given in Annex 3A.2.
When compiling emissions and sinks estimates from land use, land-use change,
and forestry with other elements of national greenhouse gas inventories,
consistent signs (+/-) must be followed. In final reporting tables, emissions
(decrease in the carbon stock, non-CO2 emissions) are always
positive (+) and removals (increase in the carbon stock) negative (-). For
calculating initial estimates, this chapter follows the convention used in
Chapter 5 of the IPCC Guidelines in which net increases of carbon stocks
are positive (+) and net decreases are negative (-). As is the case in the IPCC
Guidelines, the signs of these values need to be converted in the final
reporting tables in order to maintain consistency with other sections of
national inventory reports.
Units
Units
of CO2 emissions/removals and emissions of non-CO2 gases
are reported in gigagrams (Gg).
To convert tonnes
C to Gg
CO2, multiply the value by 44/12 and 10-3.
___________
IPCC.
2003. Good Practice Guidance for Land Use, Land-Use Change and Forestry, In Penman, J., et al., eds. Institute for Global Environmental Strategies (IGES),
Japan.