Measurement and Monitoring Soil Carbon
Current map
Current
stocks indicate the baseline SOC stock. Figure 1 indicates SOC stock for
Africa (http://www.isric.org/data/soil-property-maps-africa-1-km).
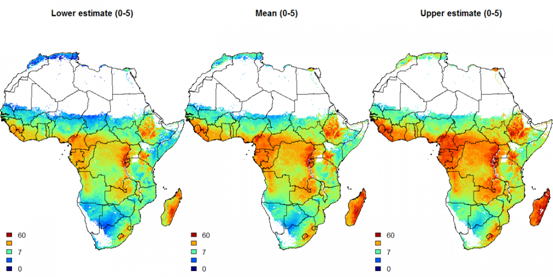
Figure 1. Prediction
maps of the lower limit, mean and upper limit (90% prediction interval) for
organic carbon (permille) for the first standard depth (0-5 cm). White pixels
indicate areas without any vegetation cover that have been masked out from the
mapping.