Measurement and Monitoring Soil Carbon
Formulas
Mean and standard error for a stratum
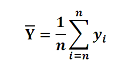 (Eq. 1)
Where
![]() denotes mean carbon stock (t ha-1),
n denotes the sample size and yi
denotes the value measured at the i-th
sampling location (plot).
denotes mean carbon stock (t ha-1),
n denotes the sample size and yi
denotes the value measured at the i-th
sampling location (plot).
![]()
Where
![]() denotes sampling variance, n denotes
sample size, yi denotes
the value measured at the i-th
sampling location (plot) and
denotes sampling variance, n denotes
sample size, yi denotes
the value measured at the i-th
sampling location (plot) and ![]() denotes mean carbon stock (t ha-1).
denotes mean carbon stock (t ha-1).
![]() (Eq. 3)
(Eq. 3)
Where SE denotes standard error and![]() denotes sampling variance.
denotes sampling variance.
Mean and standard error for
strata
![]() (Eq. 4)
(Eq. 4)
Where ![]() denotes mean SOC stock (t ha-1),
Nh denotes size of stratum
h (ha),
denotes mean SOC stock (t ha-1),
Nh denotes size of stratum
h (ha), ![]() mean SOC stock of stratum h (t ha-1) and N
denotes size of the entire study area (ha).
mean SOC stock of stratum h (t ha-1) and N
denotes size of the entire study area (ha).
(Eq.5)
Where SE denotes standard error, Nh denotes size of stratum h, ![]() variance of stratum h
variance of stratum h
Confidence interval of the
mean
![]() (Eq. 6)
(Eq. 6)
Where ![]() is the
is the ![]() ) quantile
of the Student distribution with (n-1) degree of freedom.
) quantile
of the Student distribution with (n-1) degree of freedom.