![]()
An e-publication by the World Agroforestry Centre
METEOROLOGY AND AGROFORESTRY

|
|
An e-publication by the World Agroforestry Centre |
|
METEOROLOGY AND AGROFORESTRY |
|
|
section 5 : results of agroforestry experiments The rainfall distribution at a tree/crop interface
T. Darnhofer, D. Gatama, P. Huxley and E. Akunda
International Council for Research in Agroforestry (ICRAF) Abstract Trees in agricultural cropland change the amount of precipitation which reaches the ground in their immediate vicinity. They interfere directly, through their canopy (interception, canopy drip), their branches stems (stemflow), and indirectly by modifying the wind field. Detailed rainfall measurements supplemented by wind speed recordings, were carried out along a cross section of an agroforestry experimental design, sited to give exposure to the prevailing winds. Data reliability assessments were made, and the rain gauge readings corrected to make some small compensations for wind effects. The results for 27 storms recorded over two seasons show clear modifications of the precipitation patterns at the windward and leeward tree/crop interfaces, dependent on wind speed and direction. The effects, which were much more pronounced on the leeward side of the barrier, do not extend further than once the tree height. Some implications for field experiments involving hedges are noted.
In agroforestry systems, trees and crops are grown together on the same piece of land in such a way that they interact with each other. In most situations this will not happen directly but through the modification of environmental factors. The area where the trees and the crops modify their bio-physical environment can be thought of as the tree/crop interface (TCI), and is where they compete for growth resources such as light, water and nutrients (Huxley 1983). Generally the interactions are complex, either positive or negative, and they can result in complementary or competitive effects. Many of the processes involved relate to the microclimatic conditions and result from modifications to the radiation regime, the heat balance, the wind regime and thus plant water use. In order to optimize the interactions in tree/crop combinations it is necessary to understand, and therefore to define and quantify, these conditions. Considering the complexity of the problems it appears justified first of all to break them down and relate them to sets of environmental variables with a subsequent impact assessment on the overall plant performance. At the ICRAF field station near Machakos, Kenya, a number of plots have been established since 1984 to study tree/crop interactions and to develop methodologies to assess biophysical modifications at the tree/crop interface (see Huxley et al., this Section). Because in semi-arid regions water is often the most limiting factor for plant development, we decided to investigate the rainfall re-distribution at a tree/crop interface.
Trees in agricultural cropland represent obstacles that modify the wind field; such modifications have long been recognized as affecting the rain falling in the immediate vicinity of the obstacle (e.g., Jevons 1861). Furthermore the tree itself interferes with the rainfall by holding back a part of the precipitation in the canopy (interception); by modifying the intensity and the spatial distribution of the amount that falls to ground (throughfall); and by causing another fraction of the rain to flow down the stem (stem-flow). These factors will change the distribution of the rainfall at the interface. The objective of the present study was to quantify these changes and to assess the eventual impact on the crops grown close to the trees.
General climatic conditions ICRAFs field station is situated near Machakos in the equatorial East African Highlands (1° 33' S, 37° 14' E, 15% m asl). Rainfall occurs in a bimodal pattern. The first rainy season starts around 20 March and lasts until the end of May with an average rainfall of 300 mm; the onset of the second season can be expected around 20 October with approximately 240 mm falling by 20 December. In 1986, during which the observations for this study were made, a total precipitation of 240 mm was recorded during the first rainy season and 380 mm during the second one. Observations made since 1983 indicate that at the field station most of the rain (90 %) falls in intensities above 2 mm/h and 33% have intensities higher than 10 mm/h. Mean monthly temperatures range from 17.2 °C in August to 21.0 °C in February and are close to 20 °C during the rainy seasons. Easterly winds prevail with a high consistency (80 %), both in general terms and during hours with rainfall. The annual average wind speed at 2 m above the ground is 9.7 km/h, and is about the same during hours with precipitation whatever the rainfall intensity. There is a distinct daily variation of the wind speed with minimum values around 4 km/h in the early morning hours and maximum hourly means around 15 km/h hi the late afternoon; these periods coincide reciprocally with the occurrence of maximum and minimum rainfall.
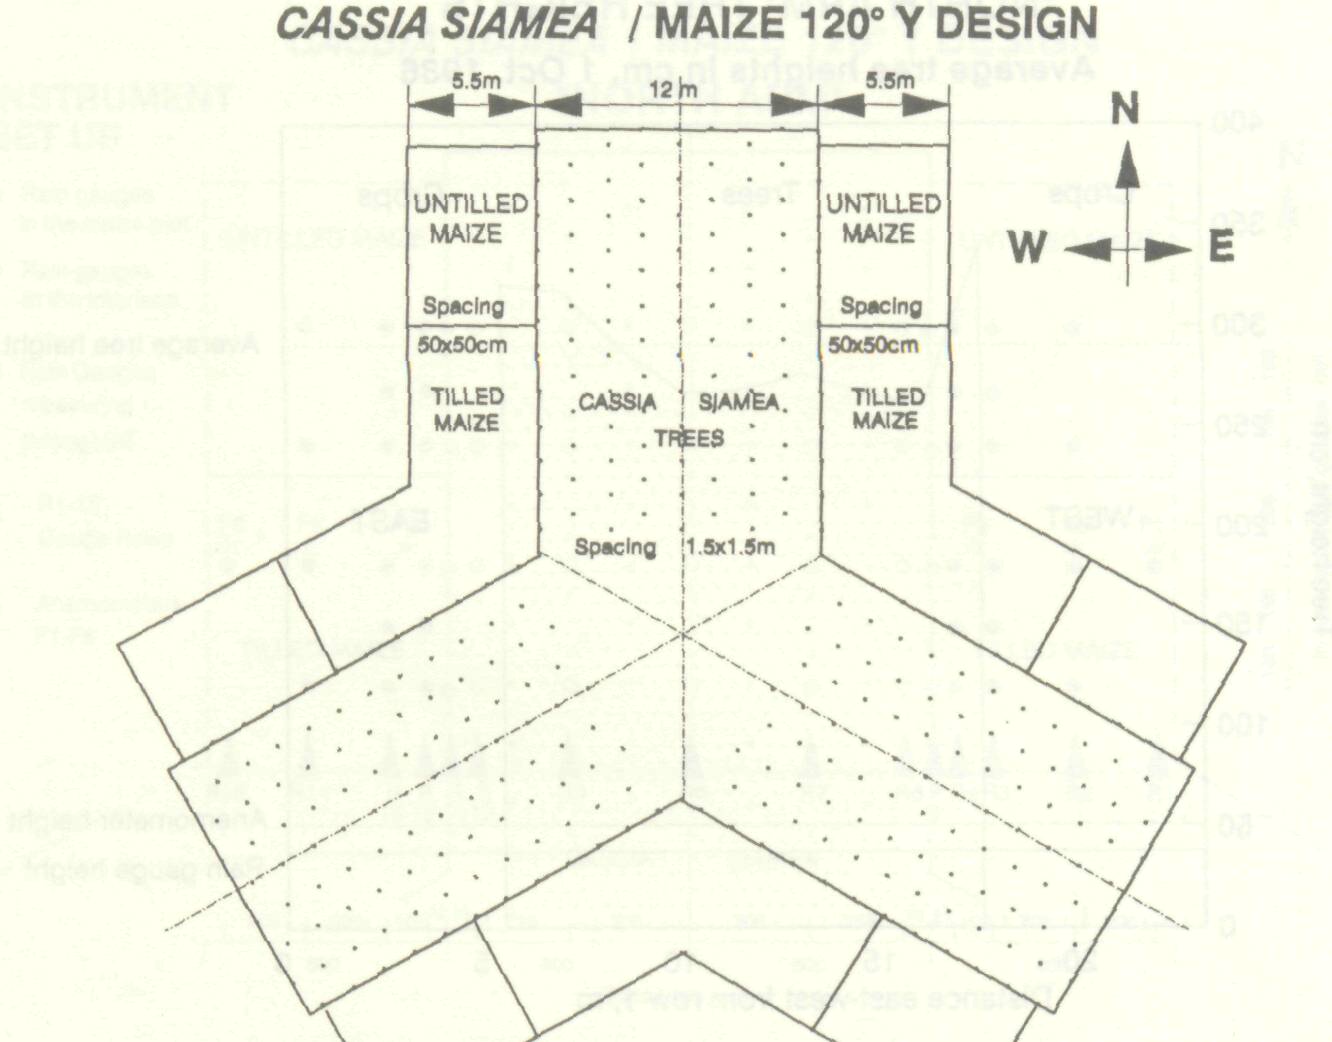
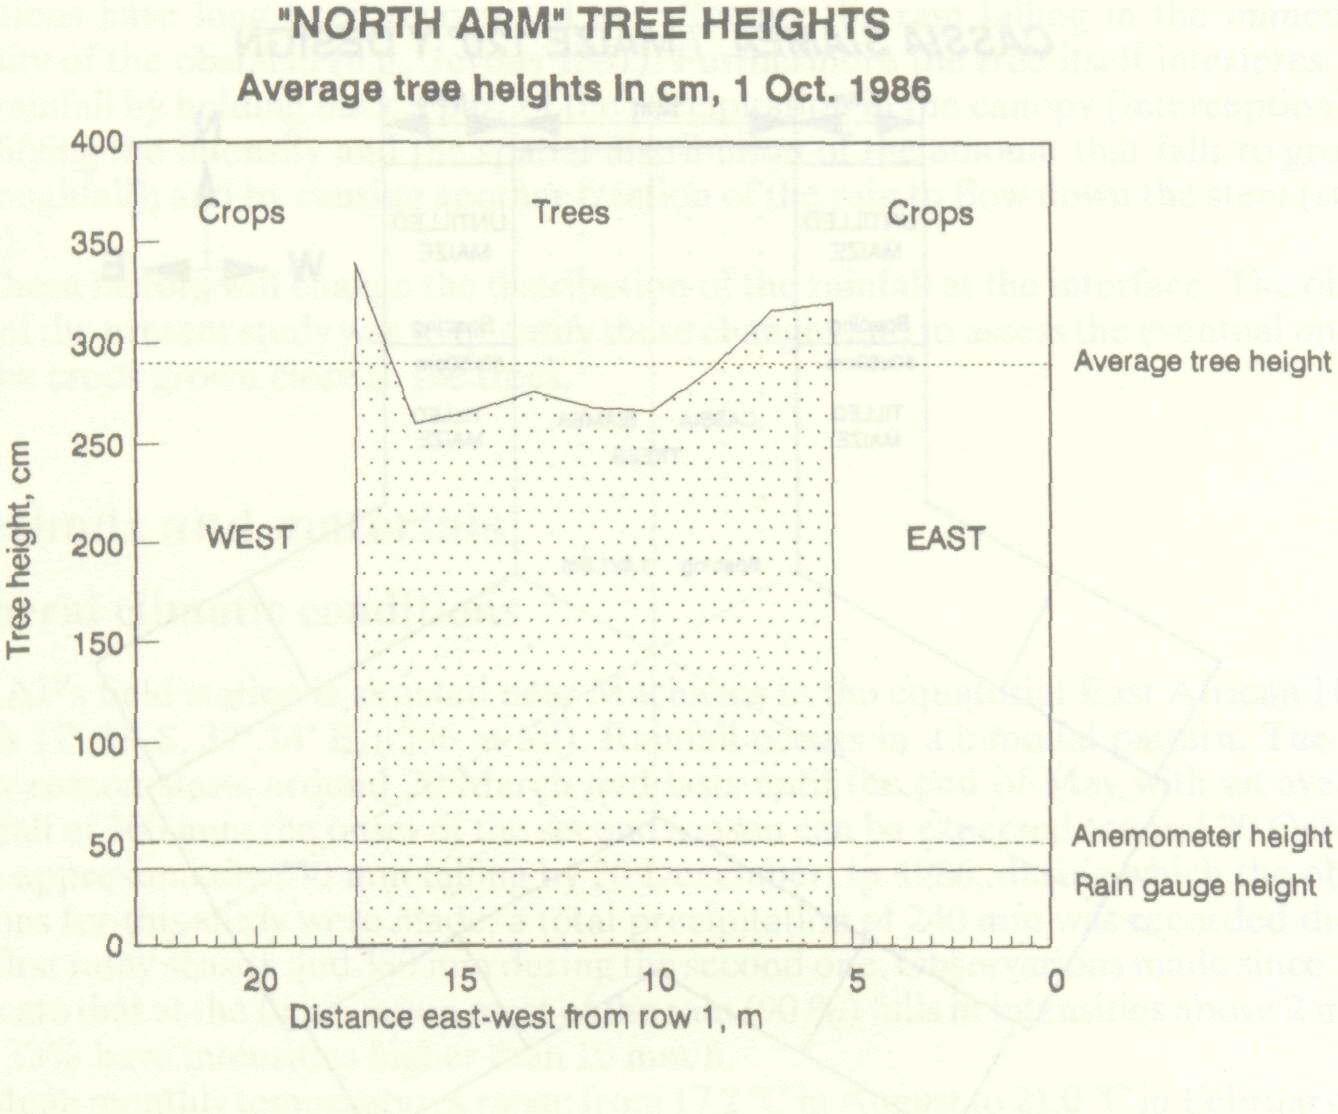
The rainfall redistribution study was carried out using an existing plot consisting of a geometric multi-row design with three arms at 120° orientation (Figure 1) planted with Cassia siamea in 1984, and first sown with an associated crop of maize in October 1985. Each arm consisted of nine rows of 12 C. siamea trees planted in a staggered pattern at 1.5 m spacing, with 11 rows of maize planted immediately adjacent at a spacing of 0.5 m with a rectangularity of 1. Individual tree heights were measured; Figure 2 shows the average canopy profile just before the second season of observations. Before the planting of the maize crop, the side branches were pruned to keep the tree/crop interface vertical.
Rainfall Rainfall measurements are subject to a number of systematic and random errors which need to be assessed and eventually corrected. Systematic errors such as wetting losses on the internal walls of the collector, losses due to evaporation, and splash-out and splash-in from the container, are influenced by the type, frequency and amount of rainfall; windspeed; saturation deficit; and the physical properties of the rain gauge (WMO 1982). In a comparative micro-scale study these losses can probably be ignored if the same type of gauge is used, readings of all collectors are made within a short time interval and gauge rims are high enough to prevent splash-in. Random instrumental errors can be minimized by assuring uniform orifice apertures, standardized collectors and horizontal gauge rim exposure. Observational errors cannot be excluded, but appropriate training and observer continuity keep this source of data variability within limits. An important systematic error is related to the deformation of the wind field above the gauge orifice. It depends largely on the wind speed at the gauge rim; the structure of the precipitation; and the shape of the collector.
To meet not only Kenyan instrument standards (KMD 1983) but also the requirement for minimum interference with the plants, we chose the Snowdon type rain gauge, with a 127 mm (5 inch) orifice diameter and a height of 37 cm, without a splayed base. A central spike was welded onto the bottom of the outer casing, which was used to fix it in the ground. The rain water was collected in a plastic container with a capacity of 500 cm3, equivalent to approximately 40 mm of rainfall. For the readings a measuring cylinder graduated to an accuracy of 0.1 mm was used. The turned brass gauge rims were manufactured to Kenya Meteorological Office specifications (KMD 1983); the coefficient of variation of the aperture areas of the 62 gauges used was found to be 0.32% with maximum deviations of 0.48%. For the recording of rain intensities and precipitation times, a tipping-bucket gauge with an eight-inch orifice (324 cm2) and connected to a datalogger, was available at the station climatological site, approximately 60 m from the experimental plot. The datalogger provided one-minute and hourly totals.
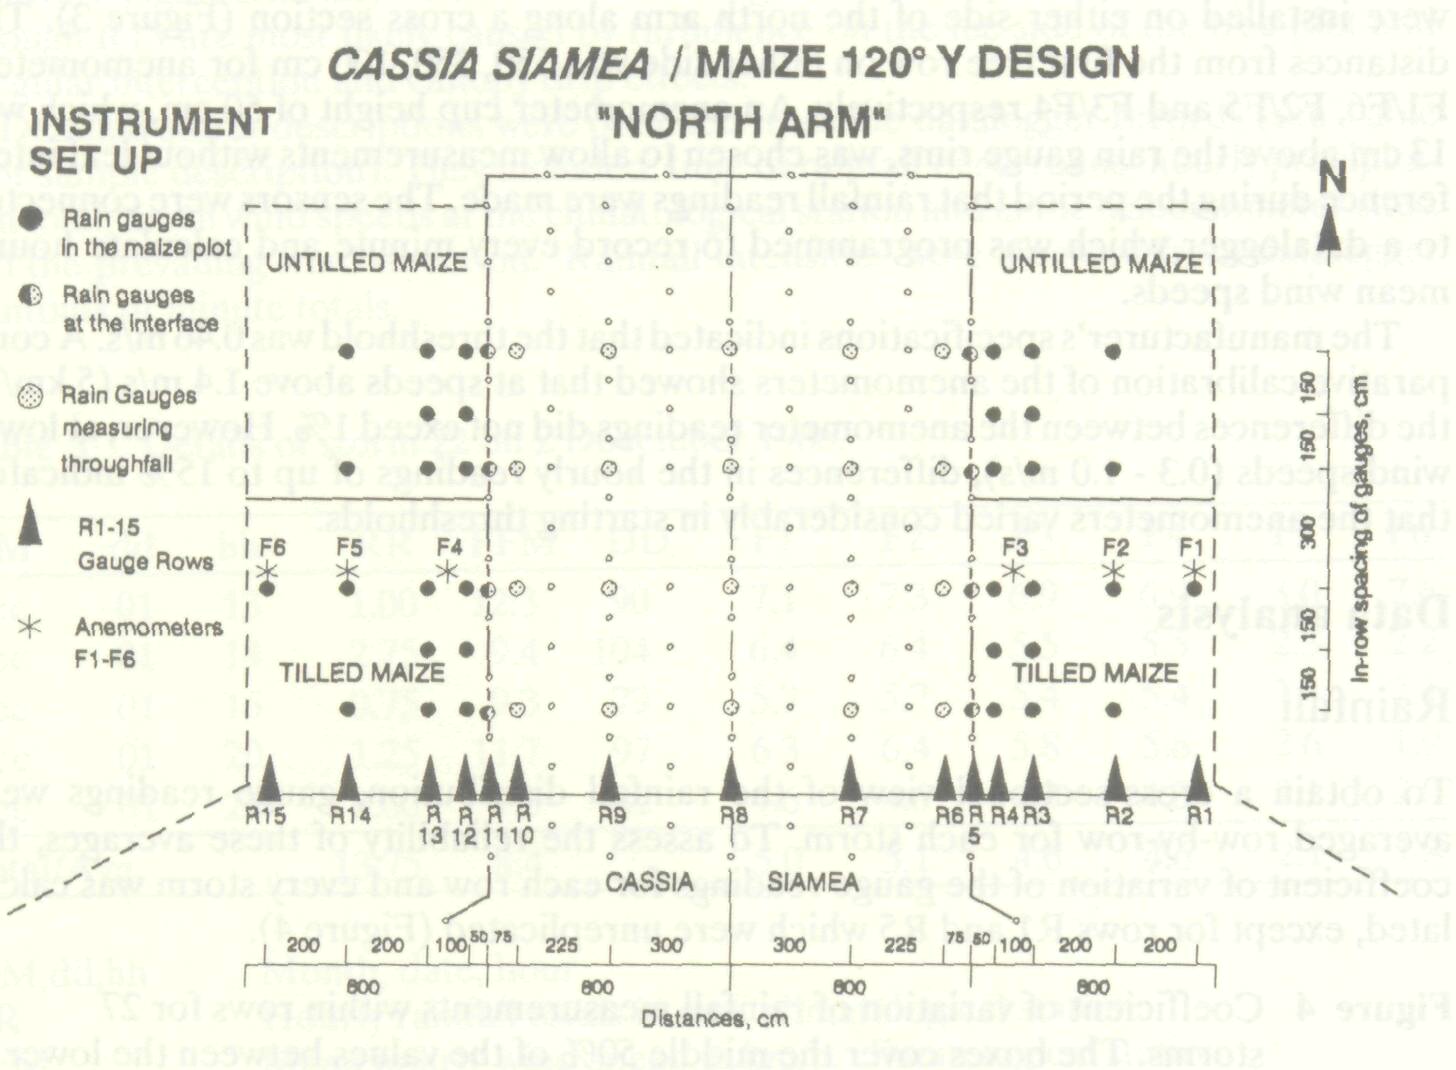
Considering the predominantly easterly winds, we decided to instrument only the northern arm of the design, as maximum re-distribution effects could be expected under this exposure. Five rows of gauges running north-south were set up in the crop plots on either side of the C. siamea plot, including one directly in the line of the first tree rows (Figure 3). An increase of variability in the amount of rainfall caught by gauges closer to tree/crop interface, due to modifications of the wind field and direct tree interference, was expected. Thus we varied the number of gauges per row from 1 (Rl) to 6 (R4, near the interface) and reduced the between-row distance.
Forms based on Figure 3 were used for field data recording and immediate checking of the readings. Gauge readings were made for every storm with 3.5 mm of rainfall or more. To avoid errors due to evaporation and wetting losses, storms below this threshold were disregarded and the gauges emptied without measurements. Once the maize crop reached the rim height of the gauges no further rainfall readings were taken, but since the maize was planted late, nearly all storms were included in the analysis, a total of 27.
Wind is likely to be one of the major factors affecting the rain distribution and the catch of a rain gauge in the vicinity of a tree/crop interface. Wind speed was measured along the cross section. Wind speed and wind direction were also measured at the climatological station 60 m away.
Three-cup anemometers (CSI Met-One 014A, the same as at the climatological station) were installed on either side of the north arm along a cross section (Figure 3). The distances from the first tree row on either side was 550,350,100 cm for anemometers F1/F6, F2/F5 and F3/F4 respectively. An anemometer cup height of 50 cm, which was 13 cm above the rain gauge rims, was chosen to allow measurements without leaf interference during the period that rainfall readings were made. The sensors were connected to a datalogger which was programmed to record every minute and calculate hourly mean wind speeds. The manufacturer's specifications indicated that the threshhold was 0.46 m/s. A comparative calibration of the anemometers showed that at speeds above 1.4 m/s (5 km/h) the differences between the anemometer readings did not exceed 1%. However, at lower wind speeds (0.3 -1.0 m/s), differences in the hourly readings of up to 15% indicated that the anemometers varied considerably in starting threshholds.
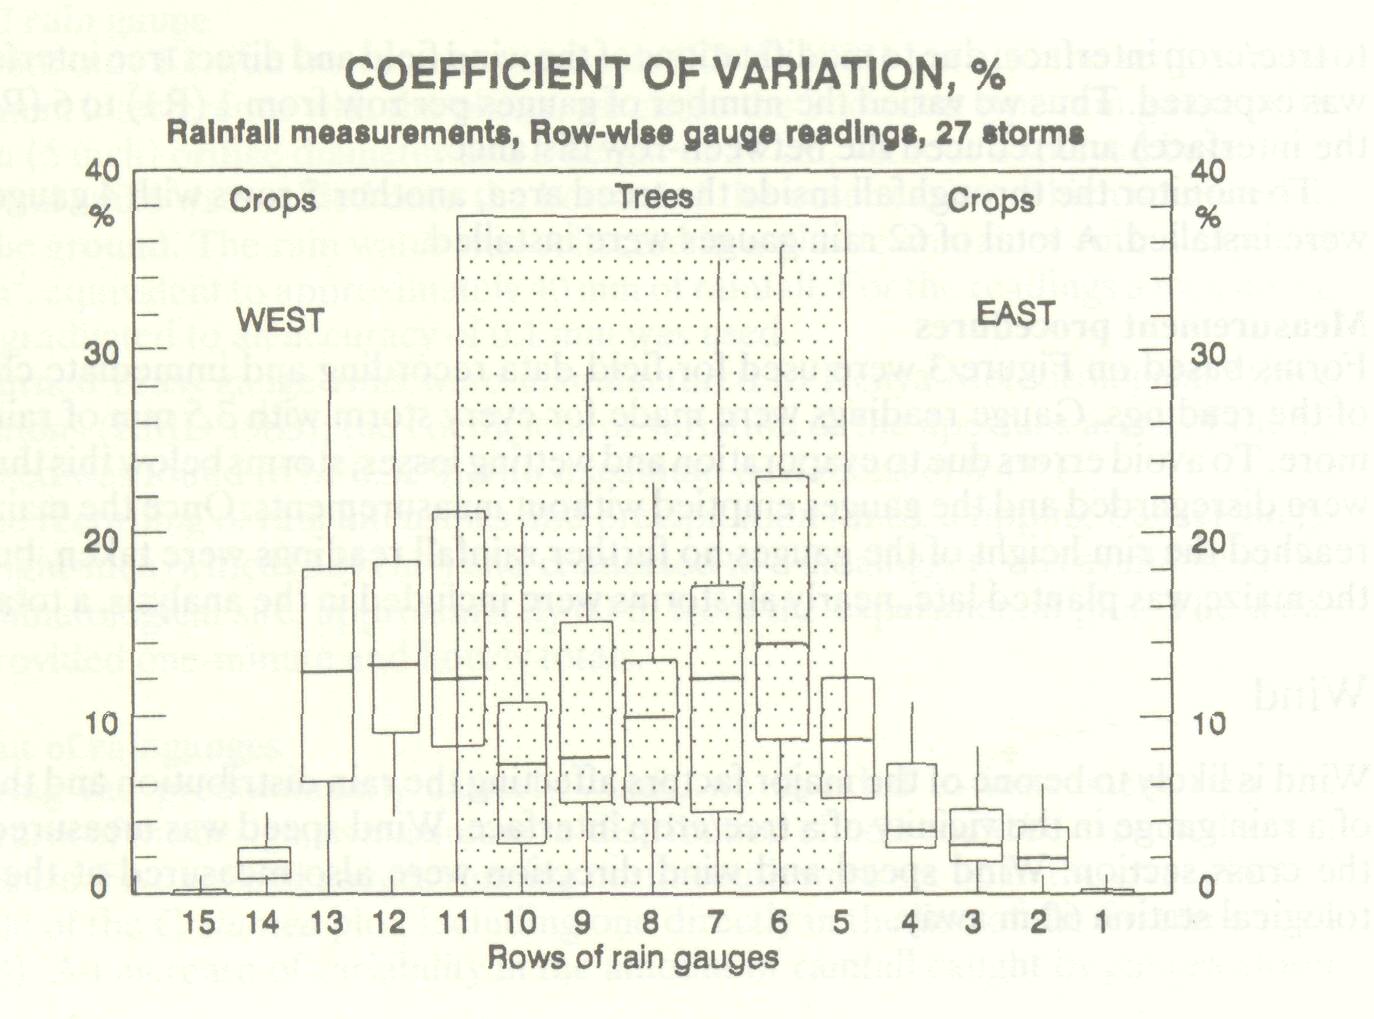
Rainfall To obtain a cross-sectional view of the rainfall distribution, gauge readings were averaged row-by-row for each storm. To assess the reliability of these averages, the coefficient of variation of the gauge readings for each row and every storm was calculated, except for rows Rl and R5 which were unreplicated (Figure 4).
Detailed storm descriptions were obtained from the datalogger records (see Table 1 for sample description). They included: time of rainfall occurrence, hourly precipitation total, mean wind speeds at the climatological station and at the 6 anemometer sites, and the prevailing wind direction. Rainfall intensities were assessed from datalogger printouts of minute totals. Table 1 Details of storm 22 on 2 December 1986.
MM,dd,hh Month, date, hour
Wind speed Average wind speeds were calculated for the anemometers Fl to F6 and are plotted in Figure 5 for easterly and westerly winds. From these data windspeed modification factors were derived for various distances from the tree/crop interface as a function of the speed at anemometer site Fl, and used to estimate the wind speeds at the rain gauge rows. Missing 'Fl' records were estimated from the anemometer at the climatological station, using the following regression equation derived from data collected during periods of simultaneous observations: Fl = 0.4717 x FFM + 1.03 (r2 = 0.84) where Fl is wind speed at Fl (km/h); and FFM is wind speed at the climatological station (km/h). This, and wind records from the climatological station, allowed the classification of the storms by prevailing wind direction and provided the necessary data set.
A method described by the World Meteorological Organization (Sevruk 1982) was used to standardize the variation of catch for gauges exposed to different wind speeds. Correction factors (k) indicating the ratio of precipitation measured in a sheltered gauge to that measured in an exposed gauge, were calculated as a function of the wind speed at the gauge rim, and rainfall structure parameters (N). The latter were derived in accordance with a method proposed by Bogadanova (1966) using rainfall intensity measurements. With easterly winds on the windward side of the tree plot, rain gauge measurements had to be adjusted by 1.2% to 1.4%. On the lee side, k was always smaller than 1.01 with an average value of 1.006. When westerly winds prevailed during rain storms, it was of course the west side that required higher adjustments. Nevertheless, differences on the lee side were less pronounced as was apparent from the average wind profile.
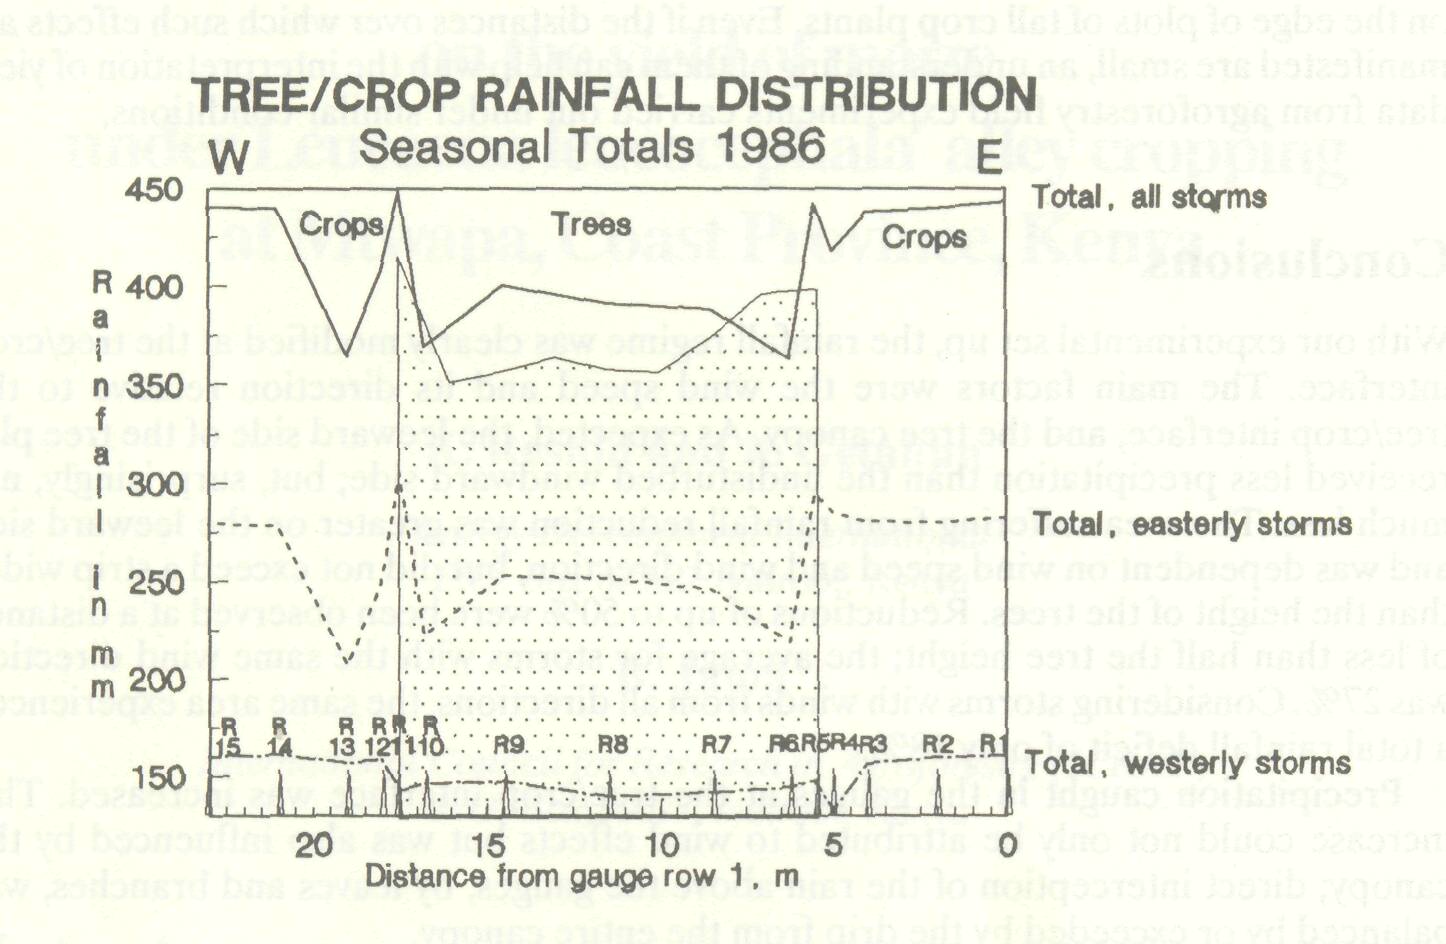
Rain gauge data for all 27 storms were grouped by rainfall amounts for storms with easterly winds (Figure 6). Data for storms with westerly winds were pooled (Figure 7). Figure 8 displays the distribution of the total rainfall amounts across the plot. Rainfall amounts with easterly winds ( 60° -130° ) generally decreased very slightly (1%) from Rl to R2 (significance of P < 5% using the one sided sign test) followed by an insignificant increase to R3. (Figure 6) From R3 to R4 a small (2%) but significant ( P < 1% ) increase was observed. At the tree/crop boundary, (R5) there was, on average a 4% higher amount of water collected in the gauges than in R4, but as for the storms 11,13,15,17,25,26 the situation was actually inverse, the significance parameter remained below 5%. Applying a paired t-test, only the increase from R3 to R4 yielded significance at 5%.
At the windward (eastern) tree/crop interface, the rainfall caught by the gauges was greater than that at the reference Rl by an average 4%; and on the leeward TCI, 8%. Values for individual storms varied from 65% to 138% and 67% to 125% at the two sides, respectively. The higher rainfall recorded close to and at the tree/crop interface is caused by direct interference of the trees. Earlier studies of the rainfall distribution under trees (-Linskens 1951) have shown that precipitation at the outer end of the tree canopy, consisting of throughfall and large drops running off leaf tips and branches, can be 10% to 20% higher than in the open. The vertical pruning of the C. siamea at the tree/crop interface would have sited this canopy drip area close to first stem row. Throughfall measurements inside the tree plot indicate that on average some 15% of the rainfall in the open is intercepted by the canopy or reaches the ground as stem-flow. For storms with a total amount of less than 10 mm, this value increases to 21% while the proportion of interception and stemflow for storms above 20 mm is only 11%. Although not completely regular, the distribution pattern of the throughfall reflects the density of the canopy. Although this was not measured, it was observed to be much denser on the outer rows than in the center of the tree plot. The relatively high precipitation at the tree/crop interface on the lee side of the plot (R11), 8% greater than at Rl, can again be explained by the canopy drip effect, which was most likely reinforced by the especially dense foliage of the taller outer tree rows.
The rainfall distribution patterns under conditions with westerly winds (Figure 7) show less distinct features, which can probably be attributed to the wider directional range of the winds ( 180° - 360°). The rain shadow effect on the lee side can however be seen on the rainfall cross-sections for the storms 5,6 and 7 which had reference wind speeds from 5 to 13 km/h during the hours of maximum rainfall, even if this effect extends only to a distance of 0.5 m from the trees. A detailed analysis of the maize crop data (see Huxley et al. this Section) did not reveal a negative influence of this rain shadow on growth or yield, suggesting that the indicated reduction of precipitation did not limit the water availability for plant development in absolute terms during these two seasons. Under conditions where the general precipitation patterns did impose growth limitations these might, however, be reinforced by such modifications of the rainfall regime adjacent to the tree/crop interface. Indeed, in such circumstances, a relatively close-planted barrier can be expected to influence rainfall redistribution similarly; e.g., with hedgerows or boundary tree lines, and on the edge of plots of tall crop plants. Even if the distances over which such effects are manifested are small, an understanding of them can help with the interpretation of yield data from agroforestry field experiments carried out under similar conditions.
With our experimental set up, the rainfall regime was clearly modified at the tree/crop interface. The main factors were the wind speed and its direction relative to the tree/crop interface, and the tree canopy. As expected, the leeward side of the tree plot received less precipitation than the undisturbed windward side; but, surprisingly, not much less. The area suffering from rainfall reduction was greater on the leeward side and was dependent on wind speed and wind direction, but did not exceed a strip wider than the height of the trees. Reductions of up to 50% were been observed at a distance of less than half the tree height; the average for storms with the same wind direction was 27%. Considering storms with winds from all directions, the same area experienced a total rainfall deficit of only 18%. Precipitation caught in the gauges at the tree/crop interface was increased. This increase could not only be attributed to wind effects but was also influenced by the canopy; direct interception of the rain above the gauges, by leaves and branches, was balanced by or exceeded by the drip from the entire canopy.
This study has been undertaken within ICRAFs 'Tree/crop interface' project, which has been largely funded by the Federal Republic of Germany through BMZ/GTZ. Appreciable use was made of facilities at ICRAFs Field Station for which SIDA has provided supporting funds.
Bogdanova, E.G. 1966. Investigation of precipitation measurement losses due to the wind. Quoted in B. Sevruk. 1982. Methods of correction for systematic error in point precipitation measurement for operational use. WMO No. 589. Jevons, W.S. 1861. On the deficiency of rain in an elevated raingauge as caused by wind. Quoted in B. Sevruk. 1982. Methods of correction for systematic error in point precipitation measurement for operational use. WMO No.589. Linskens, H.F. 1951. Niederschlagsmessungen unter verschiedenen Baumkronentypen im belaubten und unbelaubten Zustand. Ber. Dtsch. Bot. Ges. 64: 214-221. Quoted in R. Geiger, 1961. The climate near the ground, p. 326. Cambridge: Harvard Univ. Press. KMD. 1983. Rainfall observations. Observer Manual No. 1. Nairobi: Kenya Meteorological Department. Sevruk, B. 1982. Methods of correction for systematic error in point precipitation measurement for operational use. WMO No. 589. Geneva: World Meteorological Organization. |