![]()
An e-publication by the World Agroforestry Centre
METEOROLOGY AND AGROFORESTRY

|
|
An e-publication by the World Agroforestry Centre |
|
METEOROLOGY AND AGROFORESTRY |
|
|
section 4 : measurement and analysis of agroforestry experiments Inexpensive instrumentation for monitoring PAR in agroforestry S.M. Newman
Applied Biosystems Unit, Energy Research Group
Abstract A review of methods for sensing and integrating the transmissivity of agroforestry canopies to photosynthetically active radiation with reference to sampling pattern, costs and ergonomics.
I define agroforestry as an activity where woody plants (usually trees) are used in more or less intimate association with animals and/or crops in order to make use of ecological and economic interactions in the production of a wide range of materials including food, fuel, timber, fodder and chemicals. Photosynthetically active radiation (PAR) is defined as that part of the electromagnetic spectrum with wavelengths between 400-700 nm. It is that part of the sun's energy that is tapped by green plants and upon which all life ultimately depends. It is extremely useful to know how the canopy of the woody and non-woody components in an agroforestry system intercept this radiation. By knowing how much is intercepted one can calculate the photosynthetic efficiency of the system and match this against alternative canopy structures or theoretical models. By knowing about the transmissivity of the tree canopy, that is how much light passes through it, one can gauge the potential for growing an understorey crop in close association with the trees. Knowledge of the spatial and temporal variation of this available PAR is useful in the design and optimization of both overall and component crop yields. There are many general reviews on the measurement of PAR and the physiological effects of reduced PAR availability in plants (Anderson 1964; Coombs and Hall 1982; Monteith 1973; Sestak et al. 1971). In this paper I have attempted to concentrate on those aspects of special importance to the study of agroforestry.
The spatial arrangement of systems includes horizontal and vertical planes. Horizontally one can consider the system to be an arrangement of holes in the ground of a particular geometry with crops allocated in different ways. The arrangement of holes can be regular, random or with systematic variation. Regular arrangements can be square, triangular or rectangular. Plants can be allocated to these holes as rows, e.g. as in alley cropping; in a random fashion, as in hand-broadcast mixtures in Acacia scrub; or in rectangular plantations, as in fruit and nut orchards). Vertically the system can also be complex with what could crudely be described as canopy layers from different species with trees usually, but not always, occupying the top layer and herbaceous crops the bottom layer. In the more complex systems such as modified forest gardens, intermediate layers with shrubs and/or climbing vines complicate the vertical system further. Spatially, then, the most important attribute of agroforestry systems is that they are very complex. They contain complexity in that they are discontinuous and that they contain mixtures of species with different leaf and whole-plant morphology and phenology.
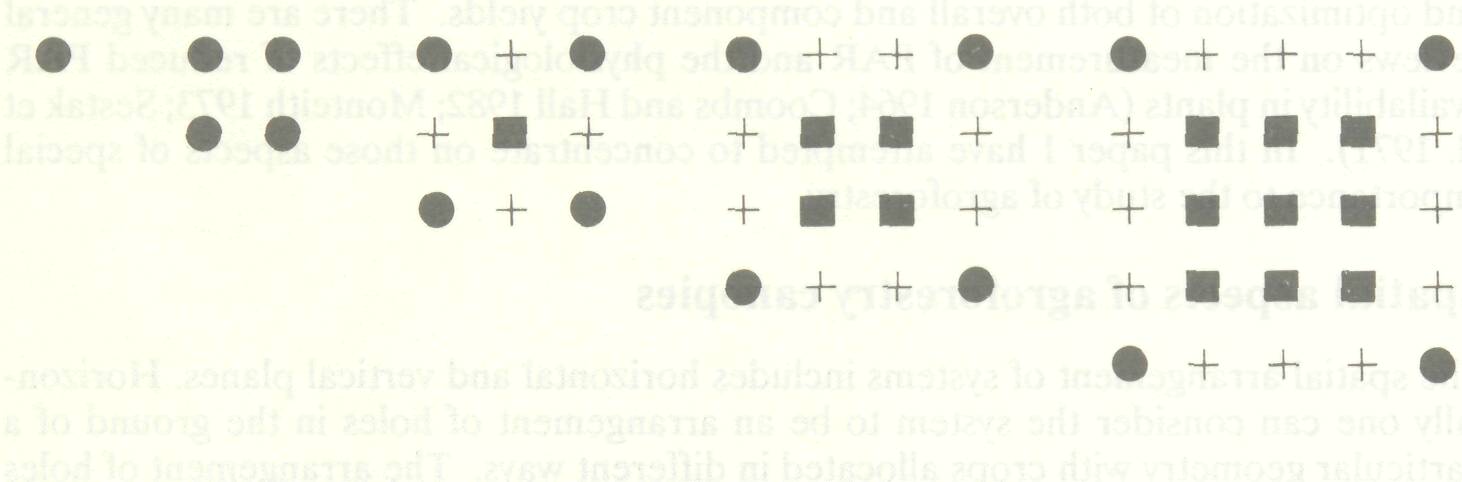
I am not going to argue that a field crop with a single tree planted at its centre is an agroforestry system. Nevertheless, there are many cases where the tree component is so widely spaced that for all intents and purposes the system is a collection of individual trees. This occurs in tea and coffee where leguminous shade trees are widely spaced and during the establishment phase of plantation tree crops when they are intercropped. Edge effects are important in small agroforests and should be studied rather than ignored or designed around. Figure 1 shows the importance of edge effects for different sized plantation and represents a tree classification based on neighbours. Many agroforests are run by smallholders and are consequently small. One can observe that if aspect is ignored then in most systems we have three broad categories of representative tree. If the trees are of different heights or species this will further complicate matters. It is a traditional and significant practice in Kerala to grow areca nut in a mixed age system with trees of 5-year age differences (Aiyer 1949). It is also evident from Figure 1 that for a repetitive rectangular array a sampling unit is a rectangle either with a tree at the centre or with a tree at each corner. For small agroforests tree height is of crucial importance in that it will directly affect the distribution of PAR available to the understorey. This is due to the important contribution made from radiation incident from the edges.
A single sensor is of no use as this will not be able to discriminate between changes due to the canopy or the atmosphere. Two sensors one above the canopy and one below will give a measure of canopy transmissivity; but where should the lower sensor be placed? In order to take into account the effect of aspect at least four sensors placed north, south, east and west will be required to adequately characterize an arrangement where the trees are not grown in continuous rows, i.e., the canopies do not touch within the row. I would suggest at least eight sensors to characterize an individual tree's #effect on the understorey replicated enough times so as to represent trees of a certain size or location. The understorey sensors should be placed at a few centimeters above the maximum height of the crop. Other layers of sensors will be needed to characterize PAR available to other species or other leaf layers if required. As the study will relate everything to the upper reference sensor, more than one should be used to insure continuity of the record in case of sensor failure. I would suggest therefore that a minimum of 15 sensors is required in most serious studies.
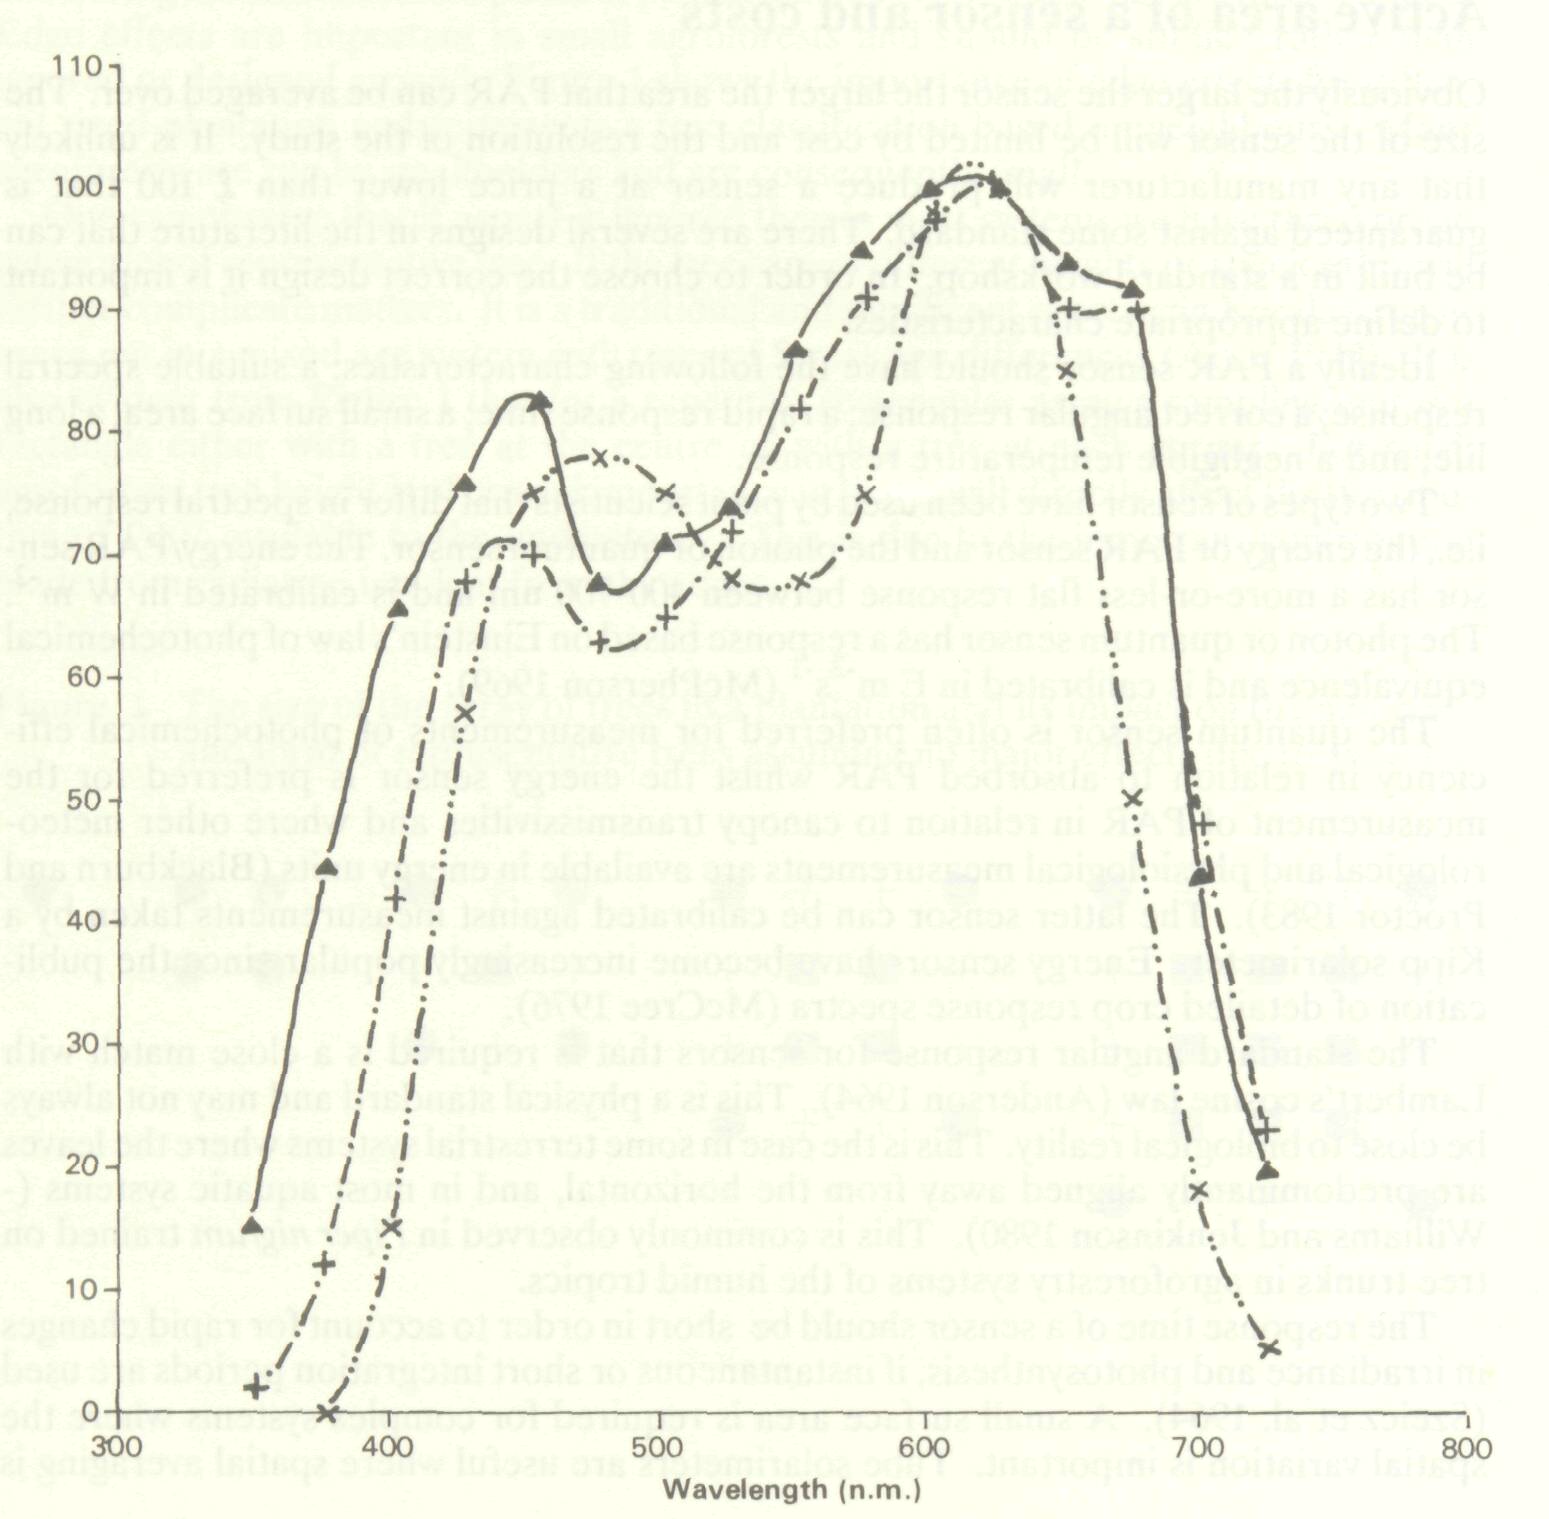
Obviously the larger the sensor the larger the area that PAR can be averaged over. The size of the sensor will be limited by cost and the resolution of the study. It is unlikely that any manufacturer will produce a sensor at a price lower than £ 100 that is guaranteed against some standard. There are several designs in the literature that can be built in a standard workshop. In order to choose the correct design it is important to define appropriate characteristics. Ideally a PAR sensor should have the following characteristics: a suitable spectral response; a correct angular response; a rapid response time; a small surface area; a long life; and a negligible temperature response. Two types of sensor have been used by plant scientists that differ in spectral response, i.e., the energy or PAR sensor and the photon or quantum sensor. The energy/PAR sensor has a more-or-less flat response between 400-700 nm and is calibrated in W m-2 . The photon or quantum sensor has a response based on Einstein's law of photochemical equivalence and is calibrated in E m-2 s-7 (McPherson 1969). The quantum sensor is often preferred for measurements of photochemical efficiency in relation to absorbed PAR whilst the energy sensor is preferred for the measurement of PAR in relation to canopy transmissivities and where other meteorological and physiological measurements are available in energy units (Blackburn and Proctor 1983). The latter sensor can be calibrated against measurements taken by a Kipp solarimeter. Energy sensors have become increasingly popular since the publication of detailed crop response spectra (McCree 1976). The standard angular response for sensors that is required is a close match with Lambert's cosine law (Anderson 1964). This is a physical standard and may not always be close to biological reality. This is the case in some terrestrial systems where the leaves are predominantly aligned away from the horizontal, and in most aquatic systems (-Williams and Jenkinson 1980). This is commonly observed in Piper nigrum trained on tree trunks in agroforestry systems of the humid tropics. The response time of a sensor should be short in order to account for rapid changes in irradiance and photosynthesis, if instantaneous or short integration periods are used (Szeicz et al. 1964). A small surface area is required for complex systems where the spatial variation is important. Tube solarimeters are useful where spatial averaging is required as in row crop situations but tend to have deficiencies in angular response when filtered to measure PAR (Blackburn and Proctor 1983). Any sensor should have minimal interference from moisture and temperature and should not 'fatigue' with high light intensities, as has been the case with many of the filters in tube solarimeters. The most popular sensor designs are based on silicon photocells with glass filters to remove the infra red response. These are stable and readily constructed (Williams and Austin 1977; Woodward and Yaqub 1979; Newman 1985). Selenium-cell-based sensors have the advantage of lower filter costs and are cheaper per unit active area in many instances (Newman 1984; Powell and Heath 1964; Jackson and Slater 1967). All sensors are used with a load resistor in the short circuit mode in order to give a linear current-irradiance relationship and improve temperature stability. The spectral response of a PAR sensor built by the author from readily available components is given in Figure 2, along with the spectral response of crop species.
Essentially this is no different from other systems in that the focus of the study will relate PAR to the period when the leaf area of the components is active. In order to compensate for changes in solar incidence angle, sampling should occur through the day either by instantaneous sampling over the sensor array or by integrating the value over the entire period. Changes in phenology throughout the year will be important in many studies.
Electronic data loggers are now a reliable method for giving detailed information on the temporal variation in intensity of PAR. But at scan rates requiring five minutes (Anderson 1964; Newman 1984) or even two minutes (Salminen et al. 1983), analysis of the large quantities of data generated may require a main frame computer. The expense of the logging and analysis of data and the problems of security and signal loss due to damage to wires often precludes their use in remote sites. In estimating canopy transmissivity, an integrated reading taken over the period of a day or more will often suffice. Several methods of integrating light measurements have been developed. These can be classified into electronic, electrochemical and photochemical methods. Commercial electronic integrators tend to be rather expensive, costing well over £ 100 (Appendix). Designs for the construction of inexpensive electronic integrators have been published (Woodward and Yaqub 1979; Saffel et al. 1979; Collocott 1980). The basic working principle is the conversion of the voltage output from a PAR sensor to a frequency which is fed to a counter. These devices can be difficult to construct in quantity and may require frequent changes of batteries if used for a long period (Woodward and Yaqub 1979). Recent advances in Complementary Metal Oxide Semiconductor (CMOS) chips with low power consumption should improve this (Collocott 1980). One design (Saffel et al. 1979) uses a calculator for the display counter and should reduce costs. Electrochemical integrators that use the voltage output from a sensor have been used in the past. These involve some form of electrolysis or electroplating to integrate the output. Examples included the Siemans-Megatron direct-current meter which involved the measurement of gas volume from the electrolysis of dilute sulphuric acid (Trickett and Moulsley 1955), unfortunately no longer available. Another way is to measure the change in weight of copper deposited on copper or silver electrodes dipped in copper nitrate solution (Powell and Heath 1964; Jackson and Slater 1967; Fairbairn 1954). A further method involved the use of mercury coulometers where the position of a small volume of electrolyte is measured after the change in volume of mercury electrodes in a capillary tube. Weighing coulometers are difficult to read and will not stand any sudden shocks during transit or use. Photochemical sensor integrators in the form of photosensitive film/solutions have been used but suffer from sensitivity to infra red and ultra violet radiation and a poor angular response (Anderson 1964). More recently, coulometers known as E cells have been used (Berman et al. 1978). These are inexpensive, accurate, can be read electronically and were used in the system outlined below.
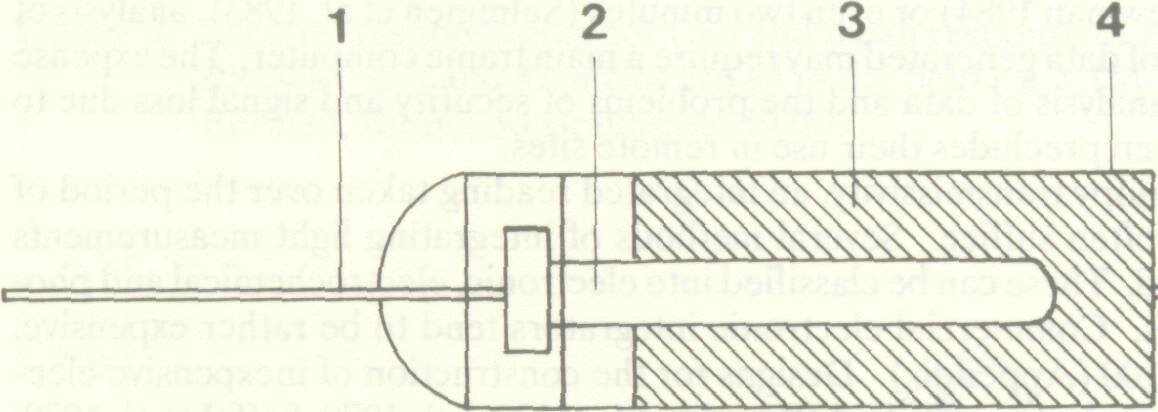
E cells are small inexpensive components consisting of a silver can electrode housing a solution of silver ions and a gold electrode (Figure 3). They are distributed by G. E. Electronics in the UK (Appendix). The cells have an impedance of about 200 ohms at room temperature. They can be connected directly to a photocell sensor with an output of 50-100ų A per kW m-2 .
The electrochemical capacity of the integrator is about 2.2 x 10¹⁹ silver atoms. The small self-contained component which looks like a small electrolytic capacitor can be readily mounted into a bnc plug. During operation, radiation reaching the sensor is converted into a current which is used to plate silver from the electrolyte onto the gold electrode. In order to 'read' the device, the E cell is removed from the circuit and a current passed in the opposite direction. The characteristics of the cell change drastically when all the silver is depleted from the gold electrode. As this point a potential difference exists that signals that the end point has been reached. The time taken for this end point to be reached is directly proportional to the total quantity of radiation falling on the sensor. Using home made sensors the cost of a sensor integrator unit was below £ 10 (-Newman 1985). The total capacity of the E cell is 1000ų A h. The output of the sensor is varied by changing the active area of the photocell. One determines the maximum amount of radiation to be recorded in kWh and attenuates the sensor to keep the integrator below full capacity during operation. This attenuation is achieved by optically masking the surface of the surface area or selecting components with appropriate surface area. It cannot be achieved by electrical means. Periods of one hour to one week can be integrated but radiation sensors should not be left unattended for more than one day due to errors produced by dirt and dust deposits. Inexpensive interfaces for low cost microcomputers can readily be constructed (Newman 1985) to time deplating and convert this into the quantity of PAR per unit area. Calibration is carried out using a Kipp solarimeter. Other sensors could be used for measuring quanta or spectral quality. The instrument is stable at a wide range of temperatures (-15 °C to + 60 °C) and can be used for over 10,000 times at low generating currents without loss of performance (Newman 1985). A certificated instrument will handle 40 channels and an RS232 interface is now available commercially (Didcot Instruments)
Due to the complex nature of agroforestry, any characterization of PAR will require the use of many sensors. The most popular sensing instrument used in complex discontinuous canopies is the filtered photocell in the form of a PAR or quantum sensor. Self-contained battery-powered integrators or E-cell integrators are recommended rather than data loggers for less-detailed agronomic studies due to lower cost, greater reliability and ease of data analysis. A list of UK manufacturers of equipment for PAR measurement is appended. Further statistical research is required to optimize sampling pattern in a spatial and temporal sense. Recent developments in materials such as photochromic glass should allow the development of stable chemical methods for integrating PAR.
Aiyer, A.K.Y.N. 1949. Mixed cropping in India. Indian J. Agric. Sci. 19: 439-543. Anderson, M.C. 1964. Light relations of terrestrial plant communities and their measurement. Biol. Rev. 39: 425-486. Berman, E., D. Biran and A. Braunstein. 1978. Sunstations. Sol. Energy 20: 465-467. Blackburn, WJ. and J.T.A. Proctor. 1983. Estimating photosynthetically active radiation for measured solar irradiance. Sol. Energy 31(2): 233-234. Collocott, S. J. 1980. Simplified insolation measurements. Sol. Energy 25:565-566. Coombs, J. and D.O. Hall (eds.) 1982. Techniques in bioproductivity and photo synthesis. London: Pergamon. Fairbairn, W.A. 1954. Difficulties in the measurement of light intensity. Emp. For. Rev. 33:262-269. Fitter, D.J., P.H. Knapp and J. Warren Wilson. 1980. Stand structure and light penetration. IV. Sensor for measuring photosynthetically active radiation. J. Appl. Ecol. 17:183-193. Jackson, J.E. and C.H.W. Slater. 1967. An integrating photometer for outdoor use particularly in trees. J. Appl. Ecol. 4: 421-424. McCree, K.J., 1976. Practical application of action spectra. In H. Smith (ed.), Light and plant development. Proceedings of the 22nd University of Nottingham Easter School of Agricultural Science. London: Butterworths, pp. 461-465. McPherson, H. 1969. Photocell-filter combinations for measuring photosynthetically active radiation. Agric. Meteorol. 6: 347-356. Monteith, J.L. 1973. Principles of environmental physics. London: Edward Arnold. Newman, S.M. 1985. Low-cost sensor integrators for measuring the transmissivity of complex canopies to photosynthetically active radiation. Agric. For. Meteorol. 2: 43-47. Powell, M.C. and O.V.S. Heath. 1964. A simple and inexpensive integrating photometer.J. Exp. Bot.15:187-191. Saffel, R.A., G.S. Campbell and E.C. Campbell. 1979. An improved micropower counting integrator. Agric. Meteorol. 20: 393-396. Salminen, R., P. Hari, S. Kellomaki, S., E. Korpilhati, M. Kotiranta and R. Sievanen. 1983. A measuring system for estimating the frequency distribution of irradiance within plant canopies. J. Appl. Ecol. 20: 887-895. Sestak, Z., J. Catsky and P.G. Jarvis (eds.). 1971. Plant photosynthetic production. Manual of methods. The Hague: Dr. W. Junk. Szeicz, G., J.L. Monteith and J.M. dos Santos. 1964. Tube solarimeter to measure radiation among plantsJ. Appl. Ecol. 1:169-174. Trickett, E.S. and LJ. Moulsley. 1955. An integrating photometer. J. Agric. Eng. Res. 1:1-11. Williams, B.A. and R.N. Austin. 1977. Short note: an instrument for measuring the transmission of short wave radiation by crop canopies. J. Appl. Ecol. 14:987-991. Williams, P J. LeB. and N.W. Jenkinson. 1980. A simple and inexpensive 4 light collector and two designs for a light meter for light attenuation studies. Freshwater Biol. 10:497-506. Woodward, F.I. 1983. Instruments for the measuring of photosynthetically active radiation and red, far red and blue light. J. Appl. Ecol. 20:103-116. Woodward, F.I. and M. Yaqub. 1979. Integrator and sensors for measuring photosynthetically active radiation and temperature in the field. J. Appl. Ecol. 16: 545-552.
Delta T. Devices Ltd., 128 Low Road, Burwell, Cambridge. |