![]()
An e-publication by the World Agroforestry Centre
METEOROLOGY AND AGROFORESTRY

|
|
An e-publication by the World Agroforestry Centre |
|
METEOROLOGY AND AGROFORESTRY |
|
|
section 4 : measurement and analysis of agroforestry experiments Ecological methods for agroforestry research S.M. Newman
Applied Biosystetms, Energy Research Group Abstract A review of ecological methods that may be applied to the agronomics of agroforestry is presented. The research has focused on the use of various techniques such as phytometers, association and discriminant analysis and their application in the study of productivity and resource use efficiency.
I define agroforestry as an activity where woody plants (usually trees) are used in more-or-less intimate association with animals and or crops in order to make use of ecological and economic interactions in the production of a wide range of materials including food, fuel, timber, fodder and chemicals. The concept underlying agroforestry then is that there may be some advantage in combining elements in an agroecosystem rather than treating them as collections of disparate single species with negligible interaction. The focus of this paper is to assess the value of certain ecological techniques in the evaluation and optimization of the interactions between the plant components in the system.
Some of the most common measures of effectiveness of agroforestry used in our research and in the literature relate to the productivity of the components in the system and the sustainability of that production within a given environmental and resource base. Some common measures of effectiveness and their context are presented below.
Can a homogeneous single product be increased by agroforestry? This simple product includes energy, animal fodder, a chemical and so on. Here we compare the total productivity, e.g. total dry matter of the agroforestry mixture, with the highest yield produced by any of the component species grown as a monoculture.
Can a supplementary crop be added to the main crop to give supplementary products without affecting the yield or profitability of the main crop? Here we assess the species, density and spatial arrangement of crops that when intercropped will not depress the yield of the main crop to unacceptable levels.
Two distinct crop products are required. Should they be grown as a mixture or as two discrete monocultures? Here we use a measure such as the land equivalent ratio (LER) which is the sum of the proportions of intercropped to sole cropped yield per unit area for each of the components in the system. For example, consider a given hectare of land that will produce 10 tons of walnuts per year or 10 tons of wheat. An agroforestry system of wheat and walnuts giving 6 tons of wheat and 7 tons of walnut would give an LER of 6/10 + 7/10 which is 1.3. An LER of greater than one indicates a yield advantage. In this system it could be said that the advantage is 30% as 30% more land would be required to produce the same yields from monocultures.
Let us assume that we have set up an experiment to see if agroforestry results in an improved total, supplementary or mixture yield and we have a result. Likely agronomic questions are:
The conventional physiological approach to these questions would be to investigate the correlation between a single environmental variable, e.g. light, and some plant process such as photosynthesis measured by a single variable such as gas exchange. This could be carried out in the field or in laboratory situations. This approach is powerful but often requires considerable expertise, time and equipment. In agroforestry with its inherent complexity this approach, if it is to be comprehensive, is often not feasible. This is especially the case in many field experiments in the tropics. The ecological approach is not a direct replacement of the above but is meant to be a complementary set of techniques to give focus to physiological investigations or to provide low cost techniques to answer physiological questions. The ecological approach attempts to use organismic responses in terms of distribution, abundance and plant process in order to factor complexes or environmental subsystems. It is inherently a multivariate approach.
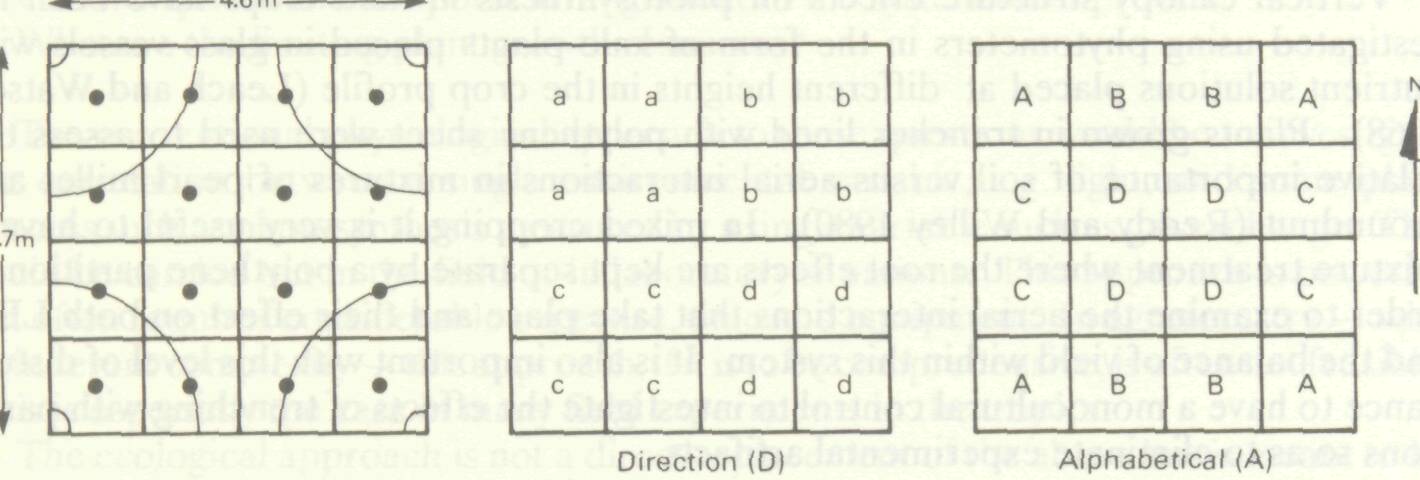
A phytometer is an individual plant or population of plants used in a controlled way to indicate the importance of various environmental factors in relation to aspects of plant form or process. These can include changes in appearance, composition, process rates, fertility and longevity. Gardeners and farmers use plants as phytometers in a qualitative sense all the time as implied by statements such as 'the plant is wilting, it needs some water'; 'brown spots on the leaves indicate a nutrient deficiency'; and 'the plant was tall and spindly due to lack of light". The use of this idea in a quantitative sense started in the 1920s when plant ecologists used transplanting techniques to determine the environmental limits to the distribution of certain species (Clements and Goldsmith 1924; Clements and Weaver 1924). A literature review by computer indicated that the technique has not been widely used in agriculture in recent times. A search through Agricola (1970-1986) and CAB (1972-1986) databases yielded only 17 references (Newman 1984; Walton and Smith 1976; Mizuochi 1969; Leach and Watson 1968; Trlica, Child and Bauerle 1985; Yokobori 1984; Hruszka 1982a, 1982b; Nasu and Kugimoto 1981; Turkington et al. 1979; Radomski, Madany and Nozyn 1977; Inserentent and De Sloover 1976; Piotrowska and Kabata-Pendias 1974; Bonde et al. 1973; Batini 1974; Rodomski, Niewiadomski and Nozynski 1974; Kochendorfer and Lee 1973). The most frequent use of phytometers is to separate aerial from soil factors. One can investigate the effect of the aerial environment which includes changes in microclimate or climate, light effects and pest and disease incidence or crop growth. This is achieved by growing plants in containers filled with compost or nutrient solutions and placing them in different situations. The compost or nutrient solution is kept uniform for each phytometer so that any variation is due to aerial factors alone. This technique has been used to investigate the geographical limits to crop growth in tundra (Walton and Smith 1976; Bonde et al. 1973) and the effects of climate on the early growth of crops in Uganda (Huxley and Beadle 1964). Plants grown in containers have been used in pollution studies (Trlica, Child and Bauerle 1985; Yokobori 1984; Nasu and Kugimoto 1981; Piatrowska and KabataPendia 1974) and root exudate or allelopathic research (Hruszka 1982a, 1982b). Vertical canopy structure effects on photosynthesis in field crops have been investigated using phytometers in the form of kale plants placed in glass vessels with nutrient solutions placed at different heights in the crop profile (Leach and Watson 1968). Plants grown in trenches lined with polythene sheet were used to assess the relative importance of soil versus aerial interactions in mixtures of pearl millet and groundnut (Reddy and Willey 1980). In mixed cropping it is very useful to have a mixture treatment where the root effects are kept separate by a polythene partition in order to examine the aerial interactions that take place and their effect on both LER and the balance of yield within this system. It is also important with this level of disturbance to have a monocultural control to investigate the effects of trenching with partitions so as to eliminate experimental artifacts. Phytometers have been used recently to investigate several effects in agroforestry (Newman 1984). In this experiment the aim was to classify certain zones of aerial environment within a plantation system in terms of the responses of potential under-storey crops. The performance of a range of crops pea, carrot, radish and onion grown in pots with adequate soil resources was assessed in various zones in a pear orchard. Some of the phytometers were placed in areas away from the influence of the trees. Others were planted in various zones in the orchard in relation to position relative to trees. With sufficient replication it is possible to classify these zones in a number of ways and test various hypotheses using analysis of variance (Figure 1). The relative performance of different species can also be assessed. Results from this kind of experiment can be used to show how close to a tree a crop can be grown and still give economic yield. It may be feasible to grow one understorey species in areas adjacent to the trees and another species farther away at the mid-point between rows. One is in effect characterizing the area of influence of the tree component. By simultaneously growing the intercrop in the ground in positions where the phytometers are placed one can compare soil versus aerial effects and thus focus physiological investigations in the appropriate direction. It may be possible to generalize about other crops from the performance of a phytometer. For instance if the response was one in which leaf dry matter was increased in areas adjacent to trees, then a reasonable hypothesis may be that crops with leaves as the economic parts should be used. Similarly a plant with a particular form of photosynthetic mechanism or physiology may closely resemble other plants. A crop from a particular taxonomic family may represent other members of that family. Obviously the most relevant phytometers are the candidate crops but in some situations it may not be possible to use them due to the difficulties of managing very large or slow growing crops in containers. It is important to measure many other plant response variables apart from economic yield in these studies in order to build up a rich picture of plant behaviour. Useful measures include root/shoot ratio, leaf length, leaf thickness etc. Many can be measured non destructively, e.g. leaf volume (Huxley 1971), and can be replicated throughout various growth stages. Most of the costs of carrying out the technique are related to labour rather than equipment.
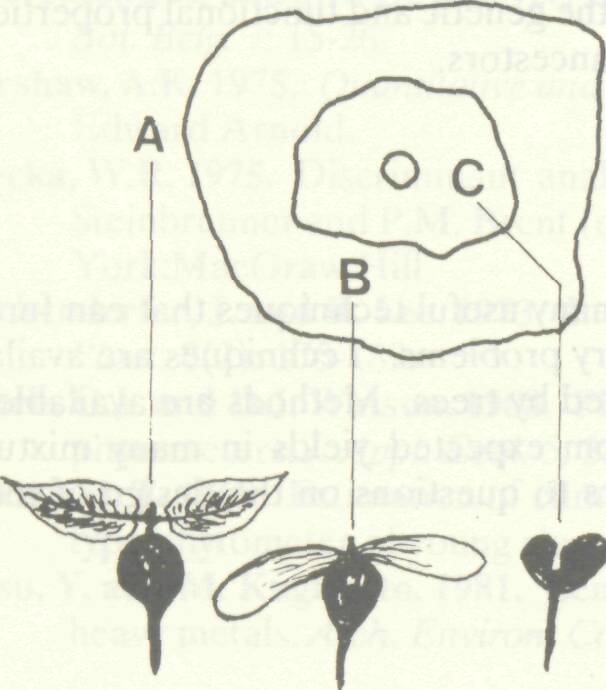
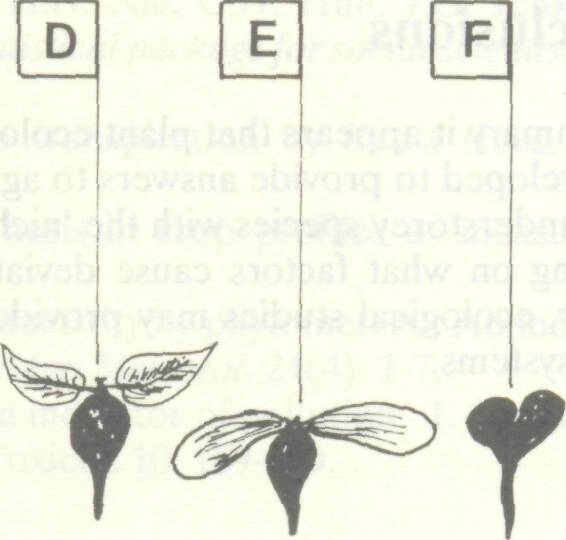
This can be done by using statistical analysis and a varied range of control treatments (Newman 1986). In the previous experiment the hypotheses generated were at the level of soil versus aerial environment or zones defined in terms of tree proximity or position. The technique can be refined to test hypotheses about shade, rooting depth, water, nutrients and so on. Consider a situation where yield is depressed in an understorey in a zone of radius 3 m from a tree in an agroforestry system. The question arises, What is the ecological basis for this? One could set up a replicated experiment with plants grown in this zone with a variety of simultaneous control treatments used to simulate effects such as levels of shade, soil depth, water availability, fertility, etc. Now consider that at the end of the experiment the intercropped plants had poor yield with thin leaves, long internodes and leaves of a particular shade of green. If plants were found with a similar form and yield in a shade treatment alone, then a reasonable hypothesis would be that shade was implicated in the intercropping system. Things rarely happen so simply in reality, so statistical techniques are required in order to discriminate the most important patterns of behaviour in the system. In graphical terms one could represent the response of each plant in multivariate space with variables such as height, root/shoot ratio, etc., used as coordinates. One should look for similarity between intercropped and control response in terms of the proximity of the resulting surfaces in multidimensional space. Discriminant analysis (Klecka 1975) can be used in this form of problem and along with other multivariate techniques can aid many steps in agroforestry research (Oranga 1981). Consider a situation where understorey crops are sampled from three zones relative to trees (Figure 2). Zone A is an area farthest away from the trees in the plantation. Zone B is an area primarily influenced by the tree canopy. Zone C is an area where the understorey is affected by the trees roots and canopy. At the same time the crop was grown in a control area with no treatments (Zone D) a shade treatment (Zone E) and a root treatment (Zone F). At the end of the experiment many variables were measured on each plant. For radish this may be leaf length, leaf dry weight, root dry weight and bulb diameter. The data are then pooled and discriminant analysis applied to find out what is the most important description of system behaviour, or more correctly, what polynomial function could best discriminate between zones. Let us assume that the best function was: y = a(w) + b(x) + c(y) + d(z) where a, b, c and d are parameters; w is leaf length; x is leaf dry weight and so on. The magnitudes of the parameters indicate the relative importance of the variables.
There is a great deal of interest in the design of agroforestry systems in terms of species composition relating to the concepts of ecological combining ability. This could be defined as the combinations of species that have mutually positive interactions. An agroforestry system with high ecological combining ability would have an understorey which enhances tree growth and vice versa. Theoretically it may be possible to trace the crop ancestors of agroforestry components and use natural associations as a basis for designing systems. One example of this is the observation that various Rubus specimens are often associated or found growing with Malus or Pyrus species in temperate woodlands. This would suggest that they have a high potential for co-existence and maybe able to partition growth resources rather than directly compete for them. This natural association is also a common crop association in the agroforestry of temperate fruit orchards where apple and pear were often intercropped with blackberry and a number of closely related shrubs (Fekete 1958). The quantitative analysis of plant associations is a central part of plant community ecology and a vast array of techniques has been developed for its analysis (-Kershaw 1975). Some of these may be appropriate for analysing the complex semi-natural agroforests of the humid tropics where the genetic and functional properties of the crop species are not too distinct from wild ancestors.
In summary it appears that plant ecology has many useful techniques that can further be developed to provide answers to agroforestry problems. Techniques are available to fit understorey species with the 'niche' created by trees. Methods are available for focusing on what factors cause deviations from expected yields in many mixtures. Finally, ecological studies may provide answers to questions on the design of totally novel systems.
I would like to thank members of the technology and mathematics faculties at the Open University for constant support on statistical and experimental matters and to Sir Ralph Verney for the use of experimental areas. I would also like to thank Maureen McManus for word processing.
Batini, F.E. 1974. Susceptibility of 'Eucalyptus marginata and Eucalyptus calophylla seedlings to infection by Phytopathora cinnamomi in nutrient solution. Forests Dept. of W. Australia Research Paper No. 14. Perth: Forestry Department. Bonde, E.K., M.F. Foreman, T.A. Babb, S. Kjelvik, J.D. McKendrick, W.W. Mitchell, F J. Wooding, L.L. Tieszen and W. Younkin. 1973. Growth and development of three agronomic species grown in pots. In L.C. Bliss and F.E. Wielgolask (eds.), Primary production and production processes, tundra biome. Boulder: University of Colorado. Clements, F.E. and G.W. Goldsmith. 1924. The phytometer method in ecology. Carnegie Inst. Wash. Publ. 242:1-512. Clements, F.E. and J.E. Weaver. 1924. Experimental vegetation. Carnegie Inst. Wash. Publ. 355:1-272. Fekete, E.B. 1958. A study of horticultural holdings in the Vale of Evesham. Thesis, University of Bristol. Hruszka, M. 1982a. Autotoxicity of wheat and field beans grown in monoculture. 1. Pot experiments. Zesz. Nauk. Akad. Rolniczo-Technicznej Olsztynie 32: 91-99. Hruszka, M. 1982b. Autotoxicity of what and field beans grown in monoculture. 2. Laboratory studies. Zesz. Nauk. Akad. Rolniczo-Technicznej Olsztynie 32: 101-107. Huxley, P.A. 1971. Leaf volume a simple method for measurement and some notes on its use in studies of leaf growth J. Appl. Ecol. 8:147-153. Huxley, P.A. and M. Beadle. 1964. A local climatic study in typical dissected topography in the southern region of Uganda. Meteorol. Mag. 93: 321-333. Inserentent, R. and J.R. De Sloover. 1976. The concept of bioindicator. Mem. Soc. Bot. Belg. 1:15-26. Kershaw, A.K. 1975. Quantitative and dynamic plant ecology. 2nd ed. London: Edward Arnold. Klecka, W.R. 1975. Discriminant analysis. In H.N. Nie, C.H. Hull, J.G. Jenkins, K. Steinbrenner and P.M. Brent (eds.), Statistical package for social scientists. New York:MacGraw Hill. Kochenderfer, J. and R. Lee. 1973. Indexes to transpiration by forest trees. Oecol. Plant. 8(2): 175-189. Leach, G J. and D J. Watson. 1968. Photosynthesis in crop profiles as measured by phytometers. J. Appl. Ecol. 5: 381-408. Mizuochi, T. 1969. Estimation of climatic productivity by phytometers. An individual type phytometer of young rice plants J.. Agr. Meteorol. 24(4): 1-7. Nasu, Y. and M. Kugimoto. 1981. Lemna as an indicator of pollution. 1. Sensitivity to heavy metals. Arch. Environ. Contam. Toxicol. 10:159-169. Newman, S.M. 1984. The use of vegetable phytometers in the evaluation of the potential response of understorey crops to the aerial environment in an interculture system. Agrofor. Syst. 2:49-56. Newman, S.M. 1986. Locating the source of interference in agroforestry systems by multivariate analysis of crop response. Int. Tree Crops J. 4:67-76. Oranga, H.M. 1981. Multivariate statistical analysis in agroforestry research. In L. Buck (ed.), Proceedings of Kenya National Seminar on agroforestry. Nairobi: ICRAF. Piotrowska, M. and A. Kabata-Pendias. 1974. Chemical composition of maize from an area contaminated by the Putawy nitrogen factory. Rocz. Nauk Roln. 100(4): 49-63. Radomski, C., R. Madany and S. Nozyn. 1977. Effect of slope microclimates on yield of cereals. Agric. Meteorol. 18(3): 203-209. Radomski, C., W. Niewiadomski and A. Nozynski. 1974. Effect of microclimate of hilly terrain on yield of potatoes. Zesz. Nauk. Akad. Rolniczo-Technicznej Olsztynie 7:73-85. Reddy, M.S. and R.W. Willey. 1980. The relative importance of above and below ground resource use in determining yield advantages in pearl millet/groundnut intercropping. In 2nd Symposium on Intercropping in Semi-arid Areas. Morogoro, Tanzania: University of Dar es Salaam. Trlica M J., R.D. Child and BA. Bauerle. 1985. Leaf injury and elemental concentrations in vegetation near a coal-fired power plant. Water Air Soil Pollut. 24(4): 375-396. Turkington, R., MA. Cahn, A. Vardy and J.L. Harper. 1979. The growth distribution and neighbour relations of Triforlium repens in a permanent pasture. 3. The establishment of Trifolium repens in natural and perturbed sites. J. Ecol. 67(1): 231-234. Walton, D.W.H. and R.I.L. Smith. 1976. Some limitations on plant growth in tundra regions an investigation using phytometers. New Phytol. 76(3): 501-510. Yokobori, M. 1984. Canonical correlation analysis of causality between air pollution intensity measured physically and its effects appraised botanically. Ibaraki Prefect. For. Exp. Sta. C: 30-33 (Japan). |