![]()
An e-publication by the World Agroforestry Centre
METEOROLOGY AND AGROFORESTRY

|
|
An e-publication by the World Agroforestry Centre |
|
METEOROLOGY AND AGROFORESTRY |
|
|
section 3 : regional examples Climatic zoning for agroforestry in Somalia P. Hutchinson
Food Early Warning Project Introduction Though Somalia has a pastoral economy, with approximately one head of cattle, one camel, two sheep and three goats to every person, relatively little is known of the distributions of natural vegetation, nor has much serious consideration been given to the development of that agroforestry which already exists within the traditional patterns of agriculture and rangeland use. Investigations are still principally based on the identification of the extent, potentialities and use of indigenous species; and on the selection and possible applications of exotics. As a contribution to the resource base for agroforestry, this paper uses the method of Teel (1984) slightly modified, to establish climatic zones suitable for use in agroforestry.
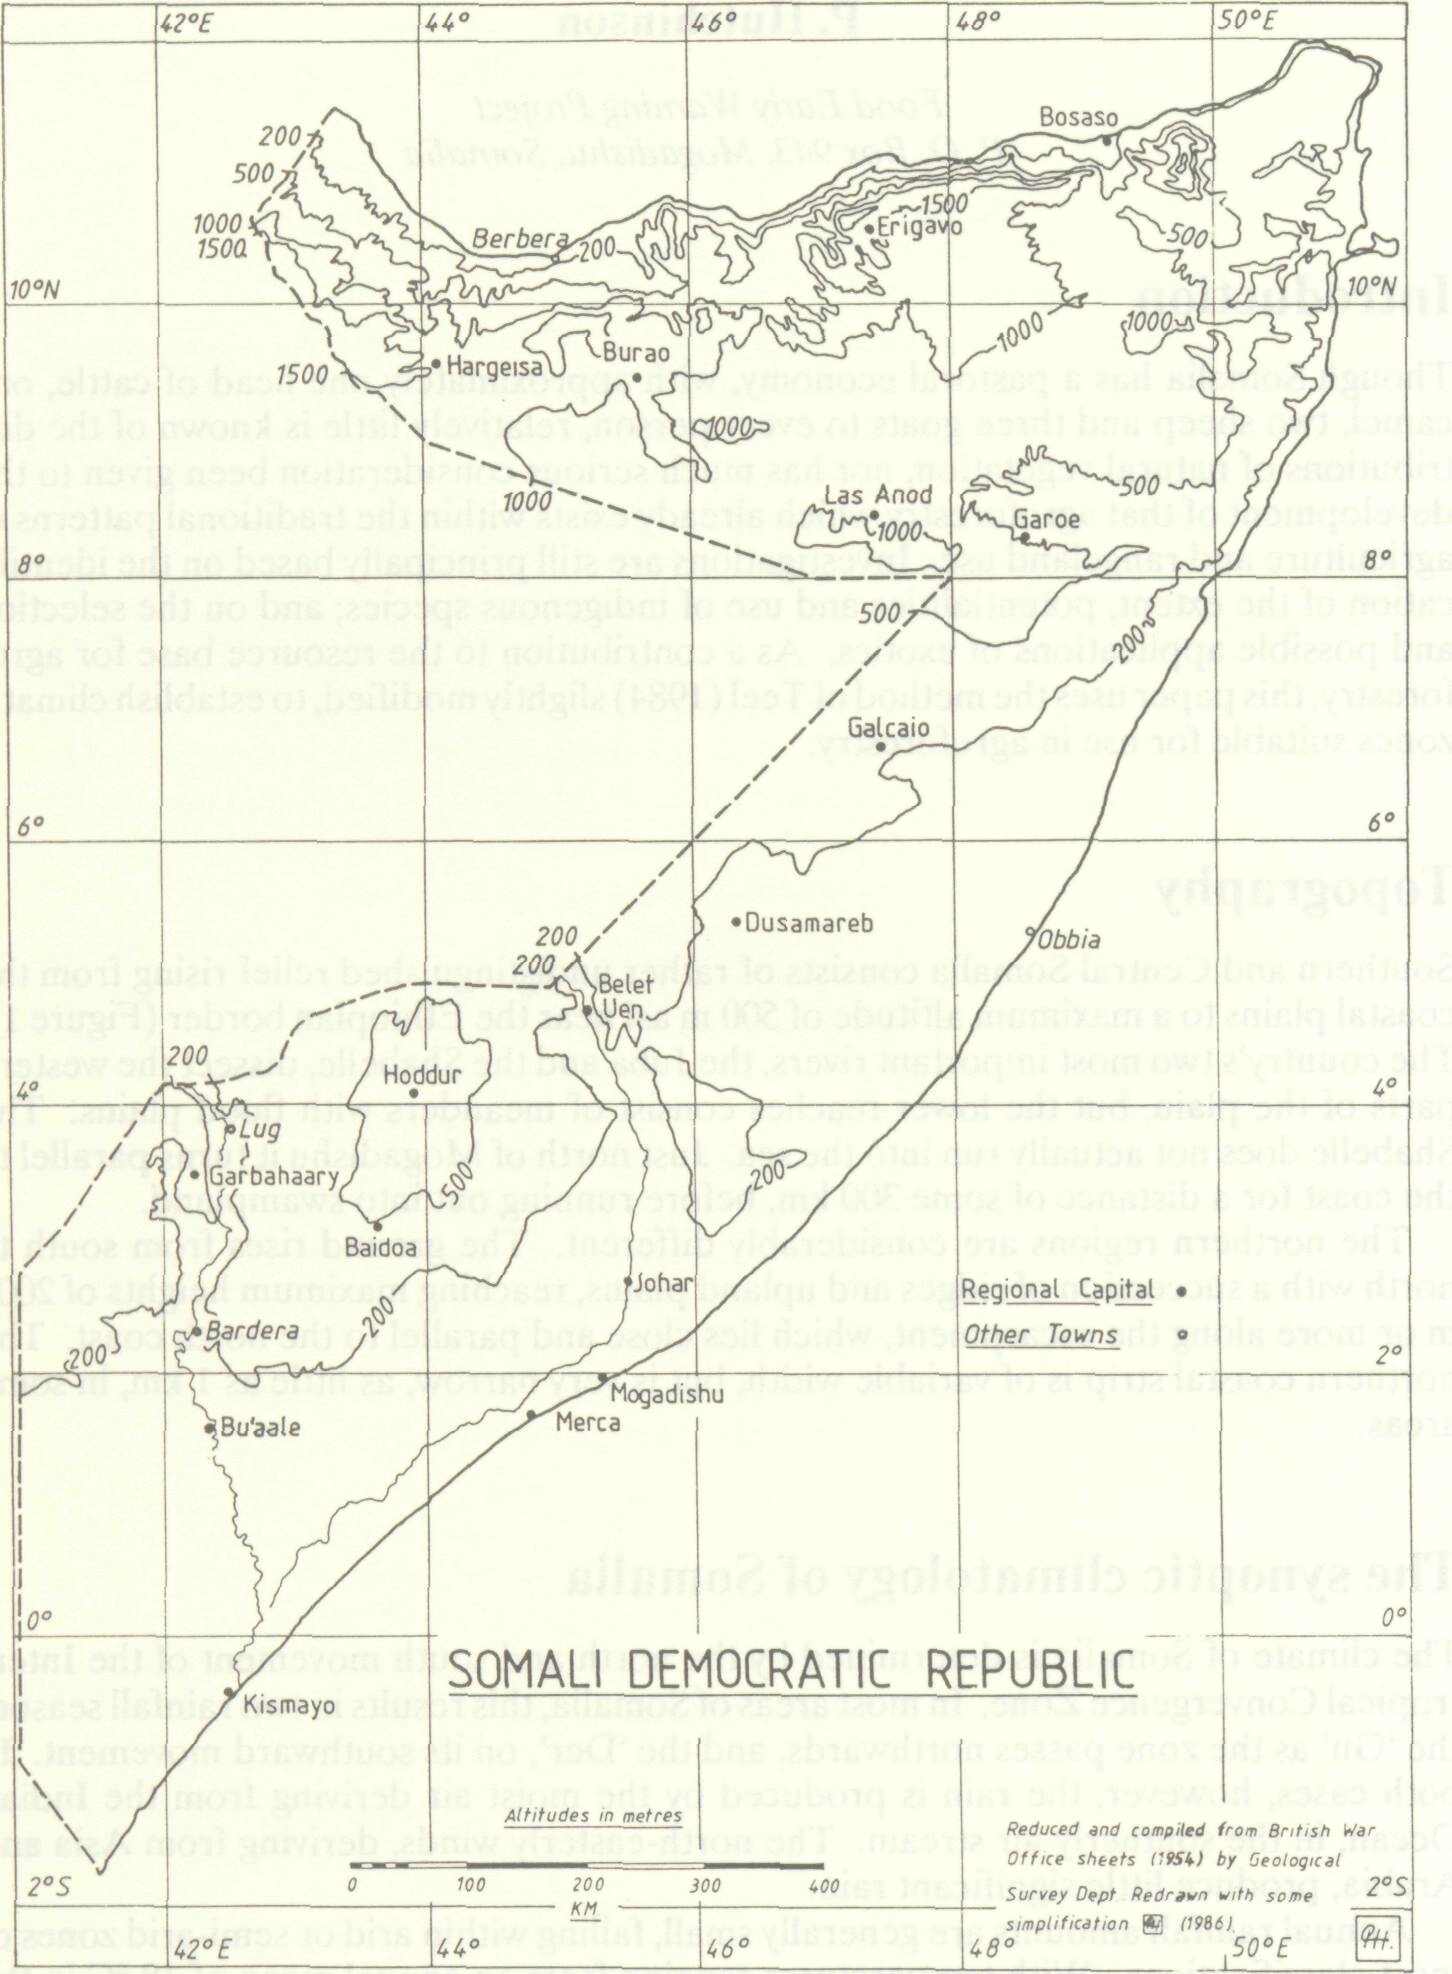
Southern and Central Somalia consists of rather undistinguished relief rising from the coastal plains to a maximum altitude of 500 m asl near the Ethiopian border (Figure 1). The country's two most important rivers, the Juba and the Shabelle, dissect the western parts of the plain, but the lower reaches consist of meanders with flood plains. The Shabelle does not actually run into the sea. Just north of Mogadishu it turns parallel to the coast for a distance of some 300 km, before running out into swampland. The northern regions are considerably different. The ground rises from south to north with a succession of ridges and upland plains, reaching maximum heights of 2000 m or more along the escarpment, which lies close and parallel to the north coast. The northern coastal strip is of variable width, but is very narrow, as little as 1 km, in some areas.
The climate of Somalia is determined by the north and south movement of the Inter-tropical Convergence Zone. In most areas of Somalia, this results in two rainfall season, the 'Gu' as the zone passes northwards, and the 'Der', on its southward movement. In both cases, however, the rain is produced by the moist air deriving from the Indian Ocean, in the southerly air stream. The north-easterly winds, deriving from Asia and Arabia, produce little significant rain. Annual rainfall amounts are generally small, falling within arid or semi-arid zones of most classifications. With temperatures ranging from an annual mean of 18 °C in the northern highlands to just over 30 °C in one or two small areas. There is thus a considerable moisture deficit over the entire country.
For the agroclimatic zonation, the method of Teel has been used, with some modification. This method is very similar to the Webb et al. (1984) system, with only the various class limits being changed. In the method, all that is required is the mean annual rainfall and mean annual temperature, though due to the limited records available, a topographic map is also needed for spatial interpolation. Rainfall and temperature are classed and overlain, to give distinct agroclimatic zones.
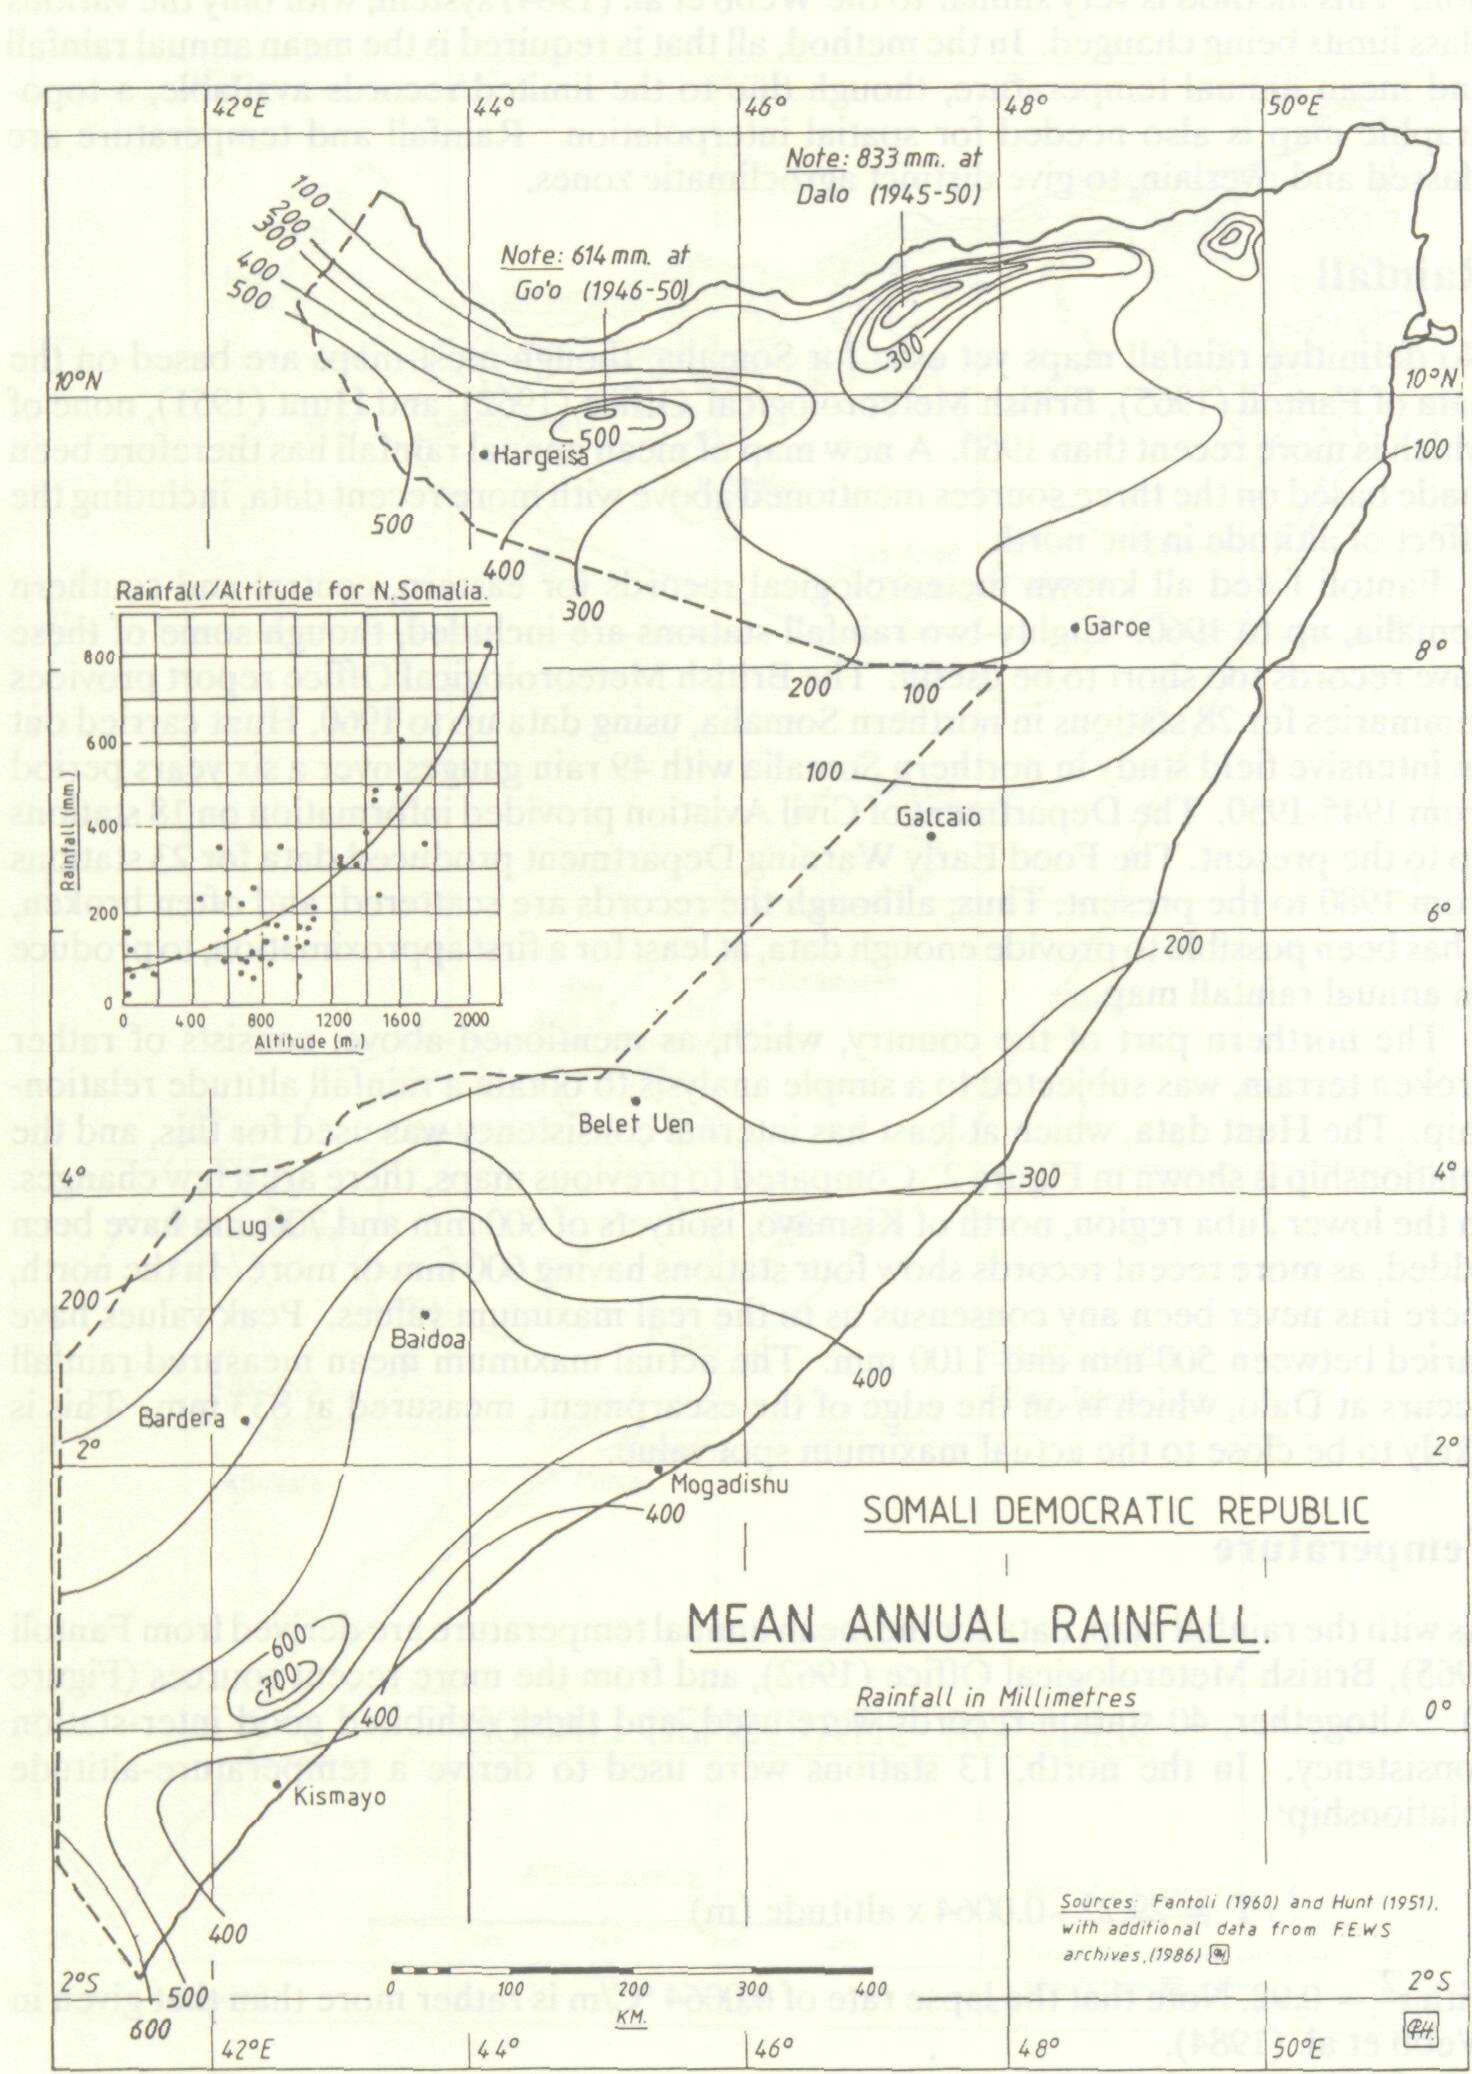
No definitive rainfall maps yet exist for Somalia, though most maps are based on the data of Fantoli (1965), British Meteorological Office (1962), and Hunt (1951), none of which is more recent than 1960. A new map of mean annual rainfall has therefore been made based on the three sources mentioned above with more recent data, including the effect of altitude in the north. Fantoli listed all known meteorological records for eastern, central and southern Somalia, up to 1960. Eighty-two rainfall stations are included, though some of these have records too short to be useful. The British Meteorological Office report provides summaries for 28 stations in northern Somalia, using data up to 1960. Hunt carried out an intensive field study in northern Somalia with 49 rain gauges over a six years period from 1945-1950. The Department of Civil Aviation provided information on 18 stations up to the present. The Food Early Warning Department produced data for 23 stations from 1980 to the present. Thus, although the records are scattered, and often broken, it has been possible to provide enough data, at least for a first approximation, to produce an annual rainfall map. The northern part of the country, which, as mentioned above, consists of rather broken terrain, was subjected to a simple analysis to obtain a rainfall altitude relationship. The Hunt data, which at least has internal consistency was used for this, and the relationship is shown in Figure 2. Compared to previous maps, there are a few changes. In the lower Juba region, north of Kismayo, isohyets of 600 mm and 700 mm have been added, as more recent records show four stations having 600 mm or more. In the north, there has never been any consensus as to the real maximum values. Peak values have varied between 500 mm and 1100 mm. The actual maximum mean measured rainfall occurs at Dalo, which is on the edge of the escarpment, measured at 833 mm. This is likely to be close to the actual maximum spot value.
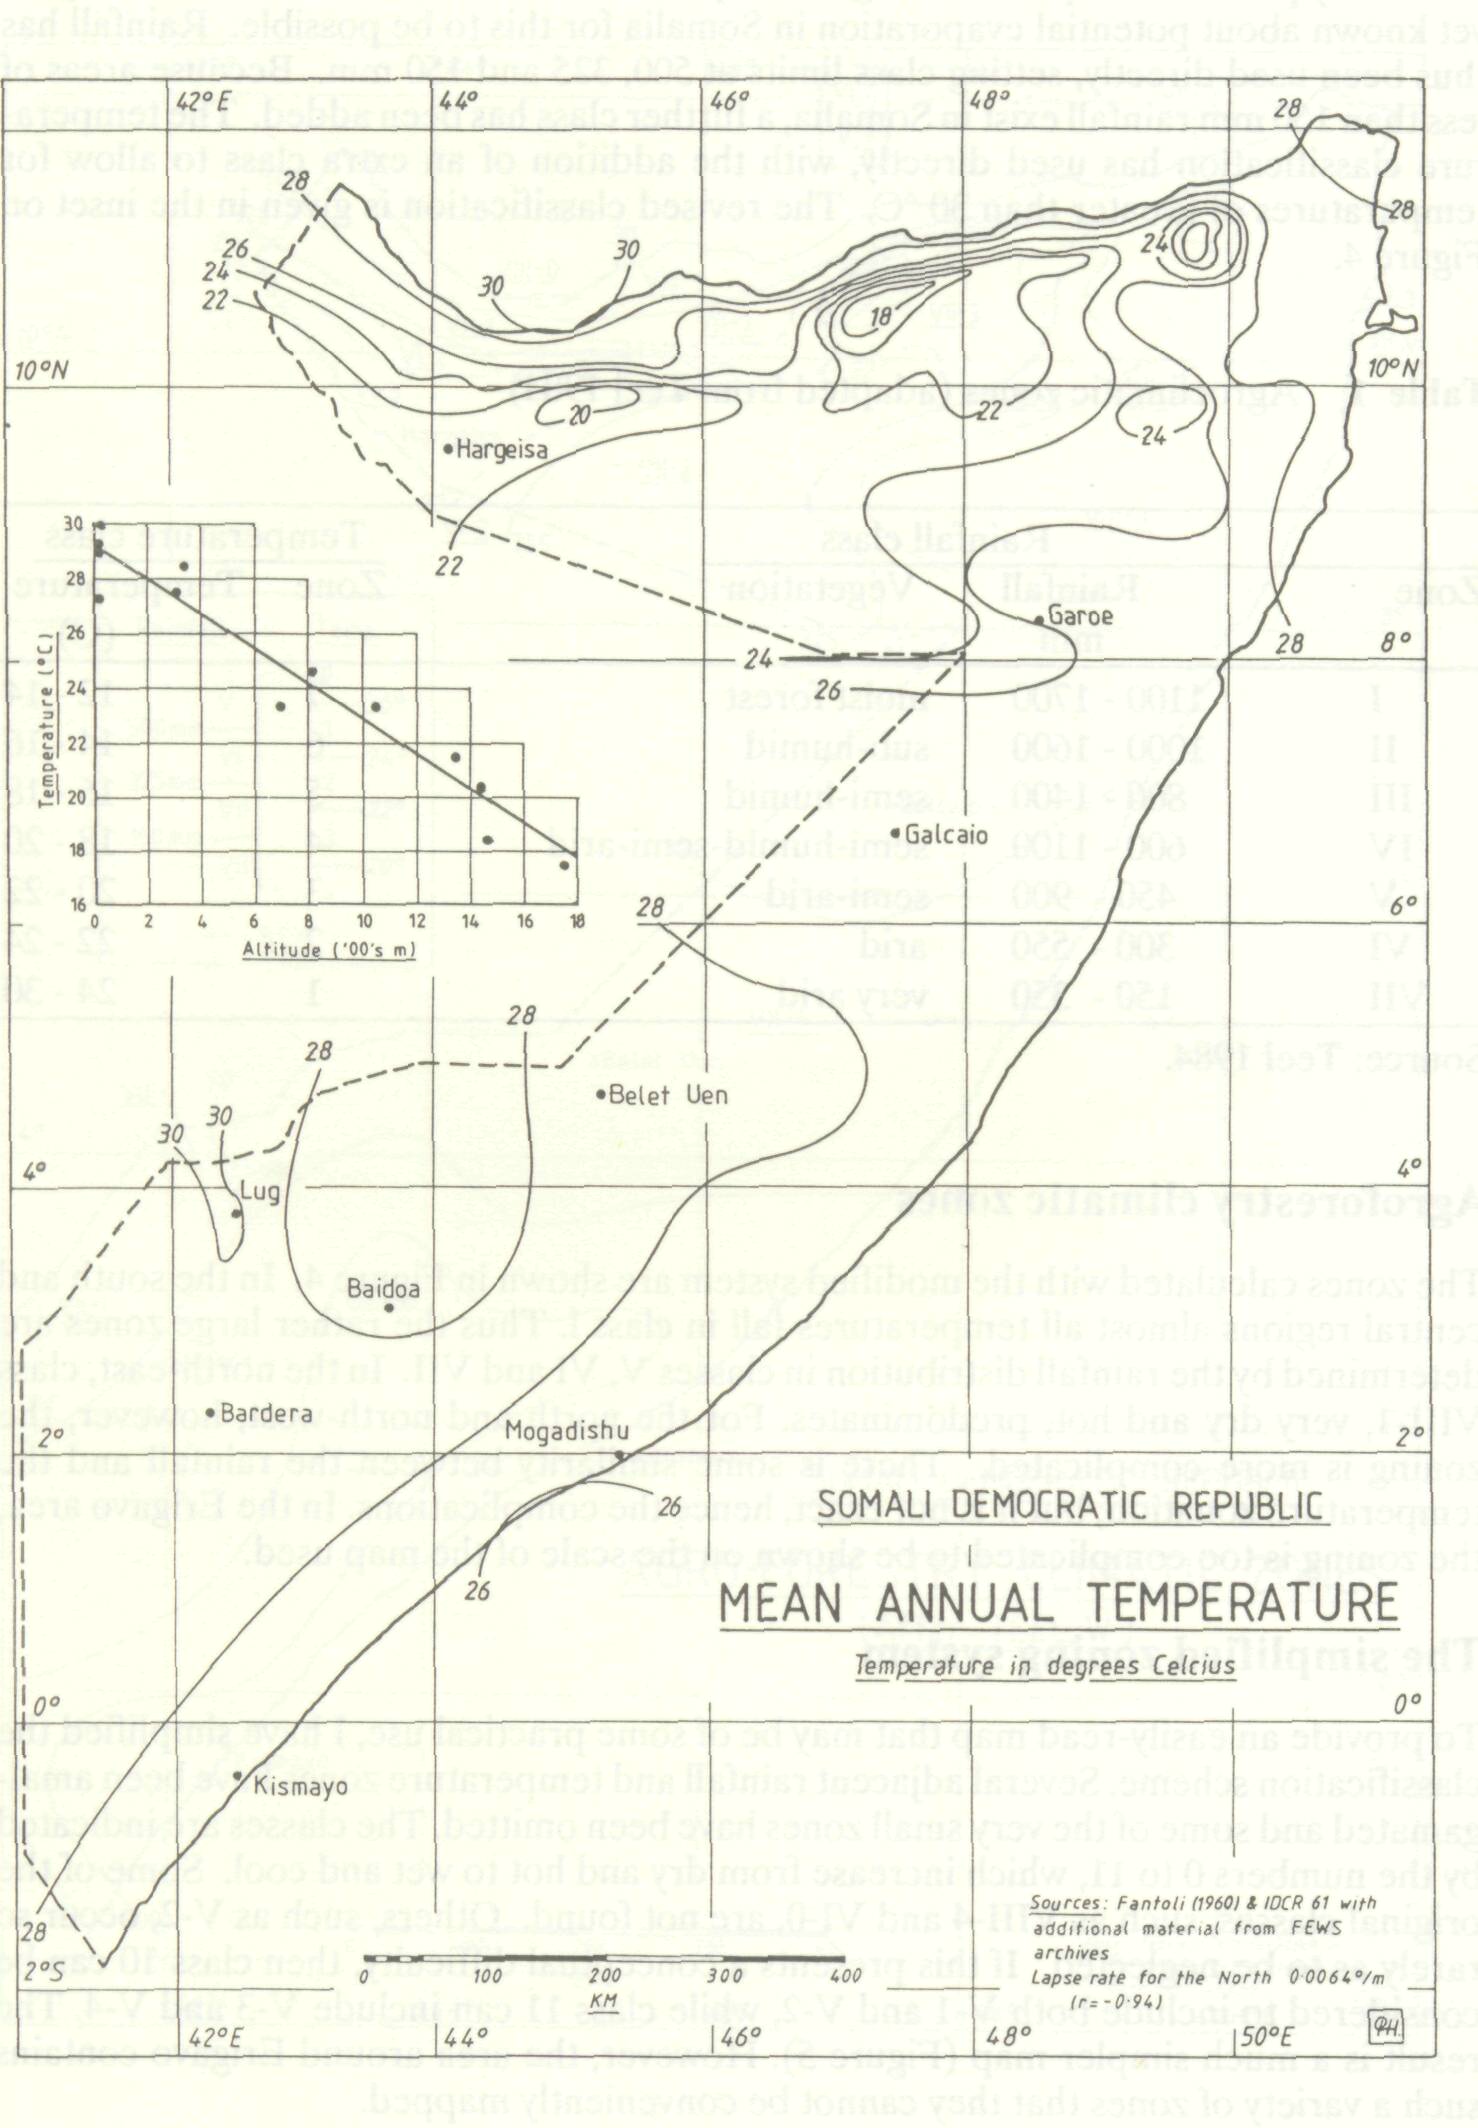
As with the rainfall map, data for the mean annual temperature are derived from Fantoli 1965), British Meterological Office (1962), and from the more recent sources (Figure 3). Altogether, 40 station records were used, and these exhibited good inter-station consistency. In the north, 13 stations were used to derive a temperature-altitude relationship: T = 29.22 - 0.0064 x altitude (m) with r2 = 0.92. Note that the lapse rate of 0.0064 °C/m is rather more than that given in Webb et al. (1984).
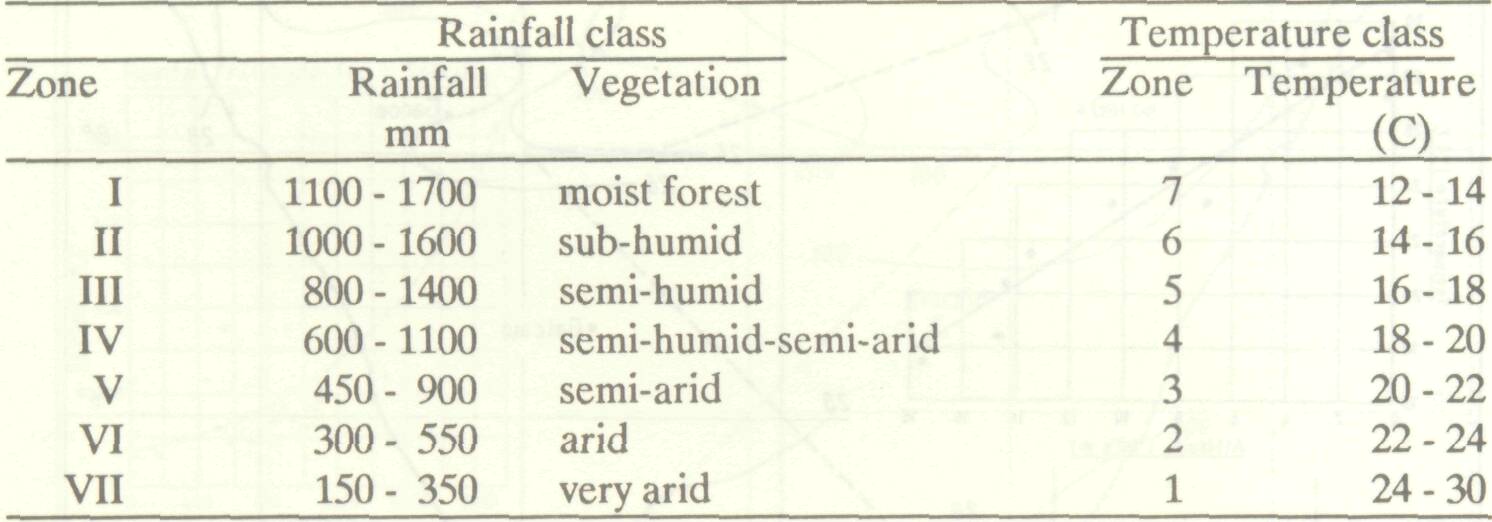
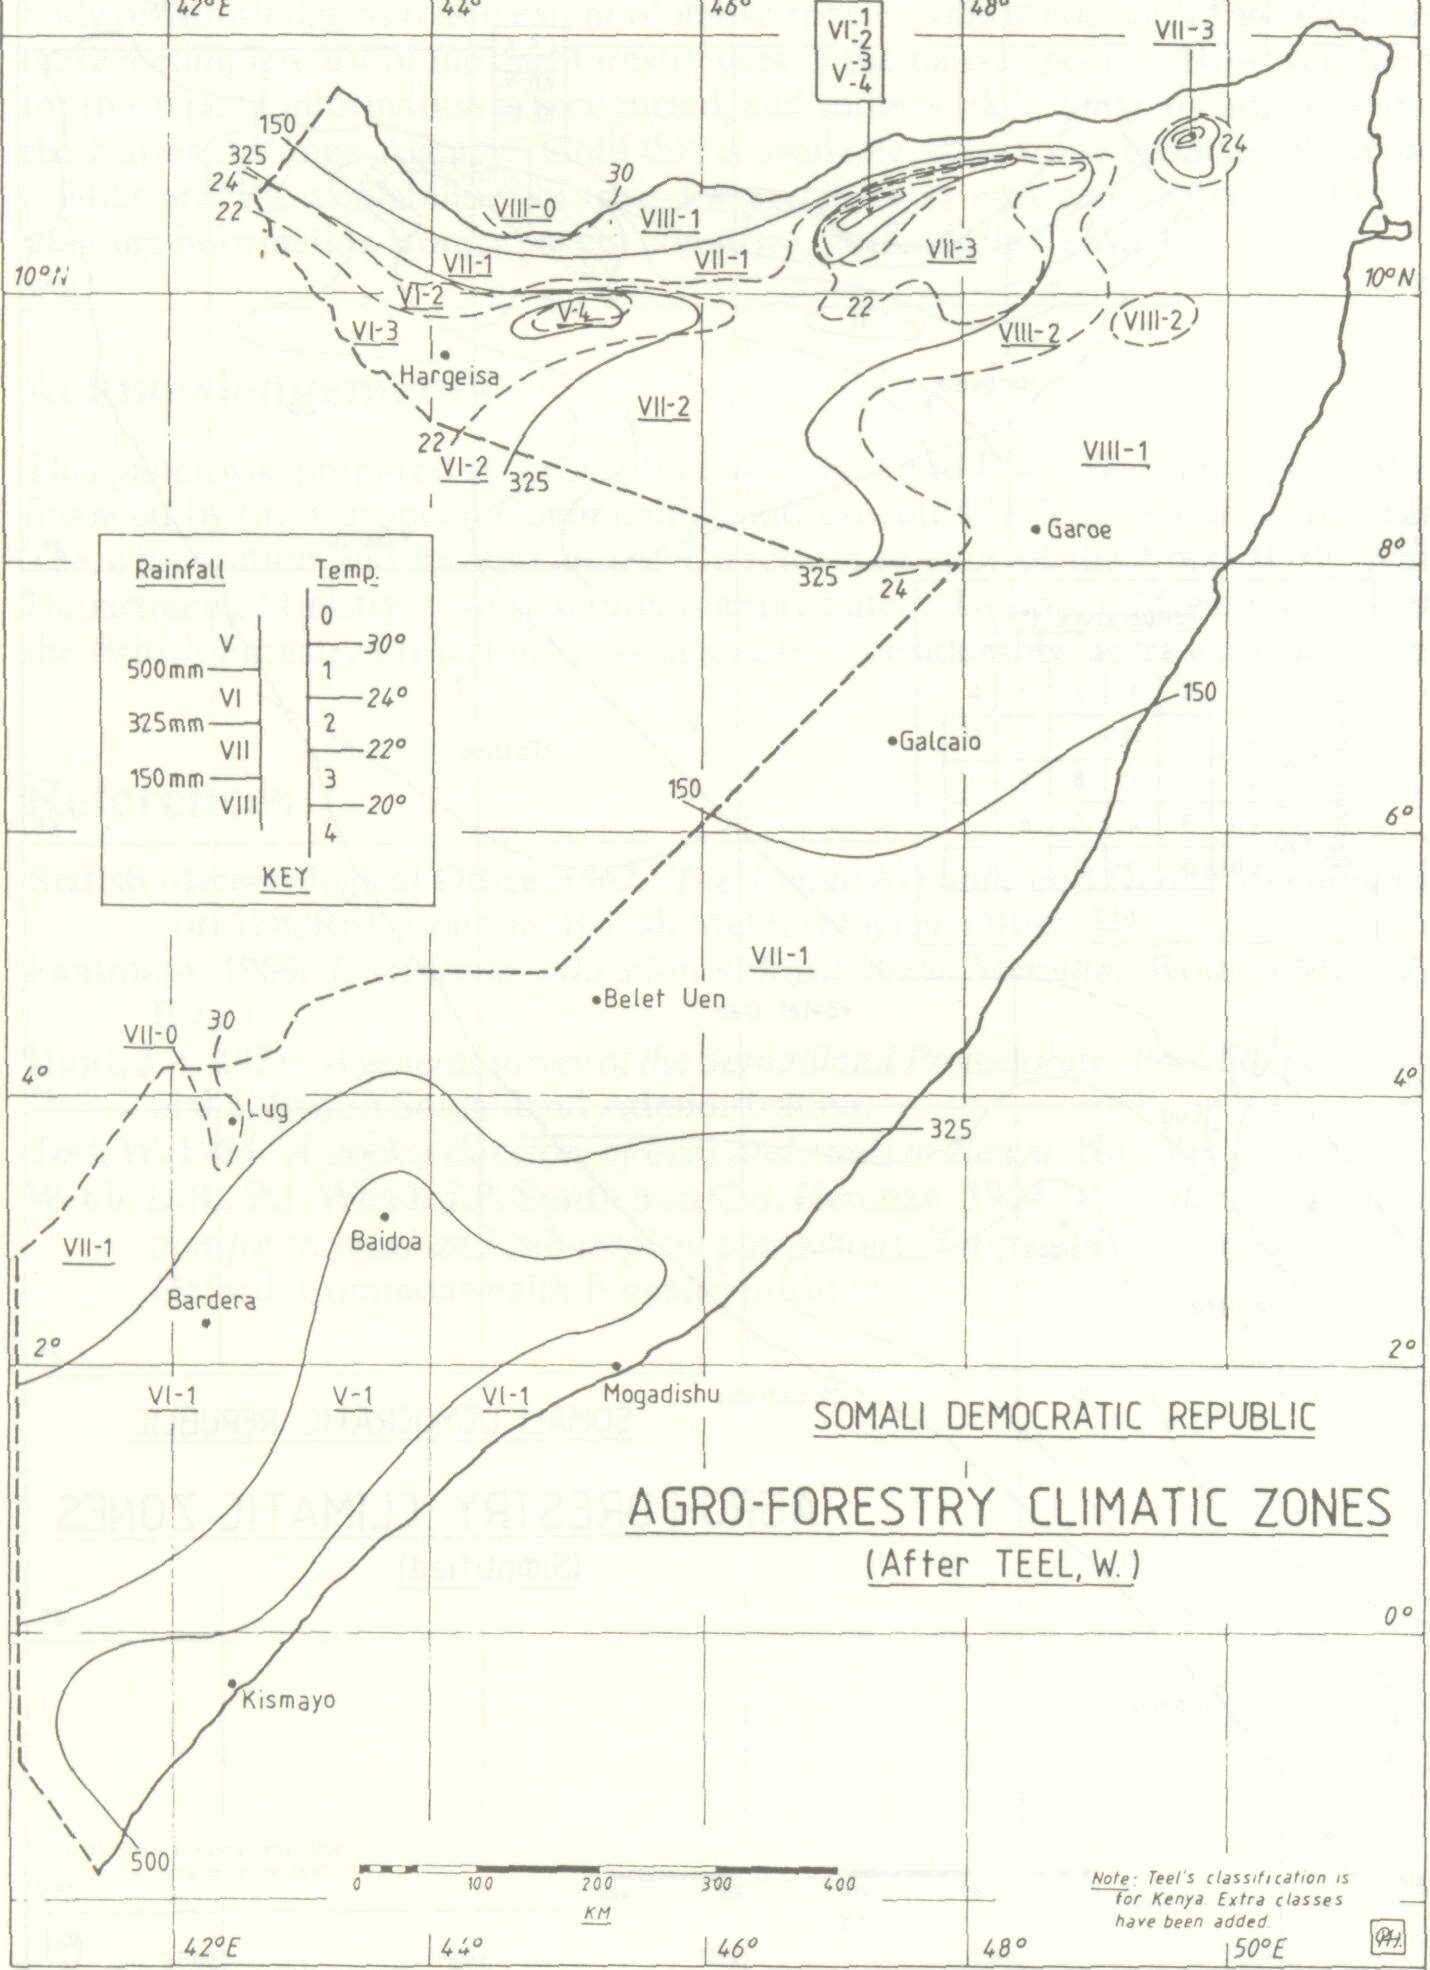
Table 1 shows part of the original Teel tables. In the original, the rainfall classes are divided by potential evaporation to give unique classification. However, not enough is yet known about potential evaporation in Somalia for this to be possible. Rainfall has thus been used directly, setting class limits at 500, 325 and 150 mm. Because areas of less than 150 mm rainfall exist in Somalia, a further class has been added. The temperature classification has used directly, with the addition of an extra class to allow for temperatures of greater than 30 °C. The revised classification is given in the inset on Figure 4. Table 1 Agroclimatic zones (adapted from Teel 1984)
Source: Teel 1984.
The zones calculated with the modified system are shown in Figure 4. In the south and central regions almost all temperatures fall in class 1. Thus the rather large zones are determined by the rainfall distribution in classes V, VI and VII. In the north-east, class VIII-1, very dry and hot, predominates. For the north and north-west, however, the zoning is more complicated. There is some similarity between the rainfall and the temperature zonation; but it is not exact, hence the complications. In the Erigavo area, the zoning is too complicated to be shown on the scale of the map used.
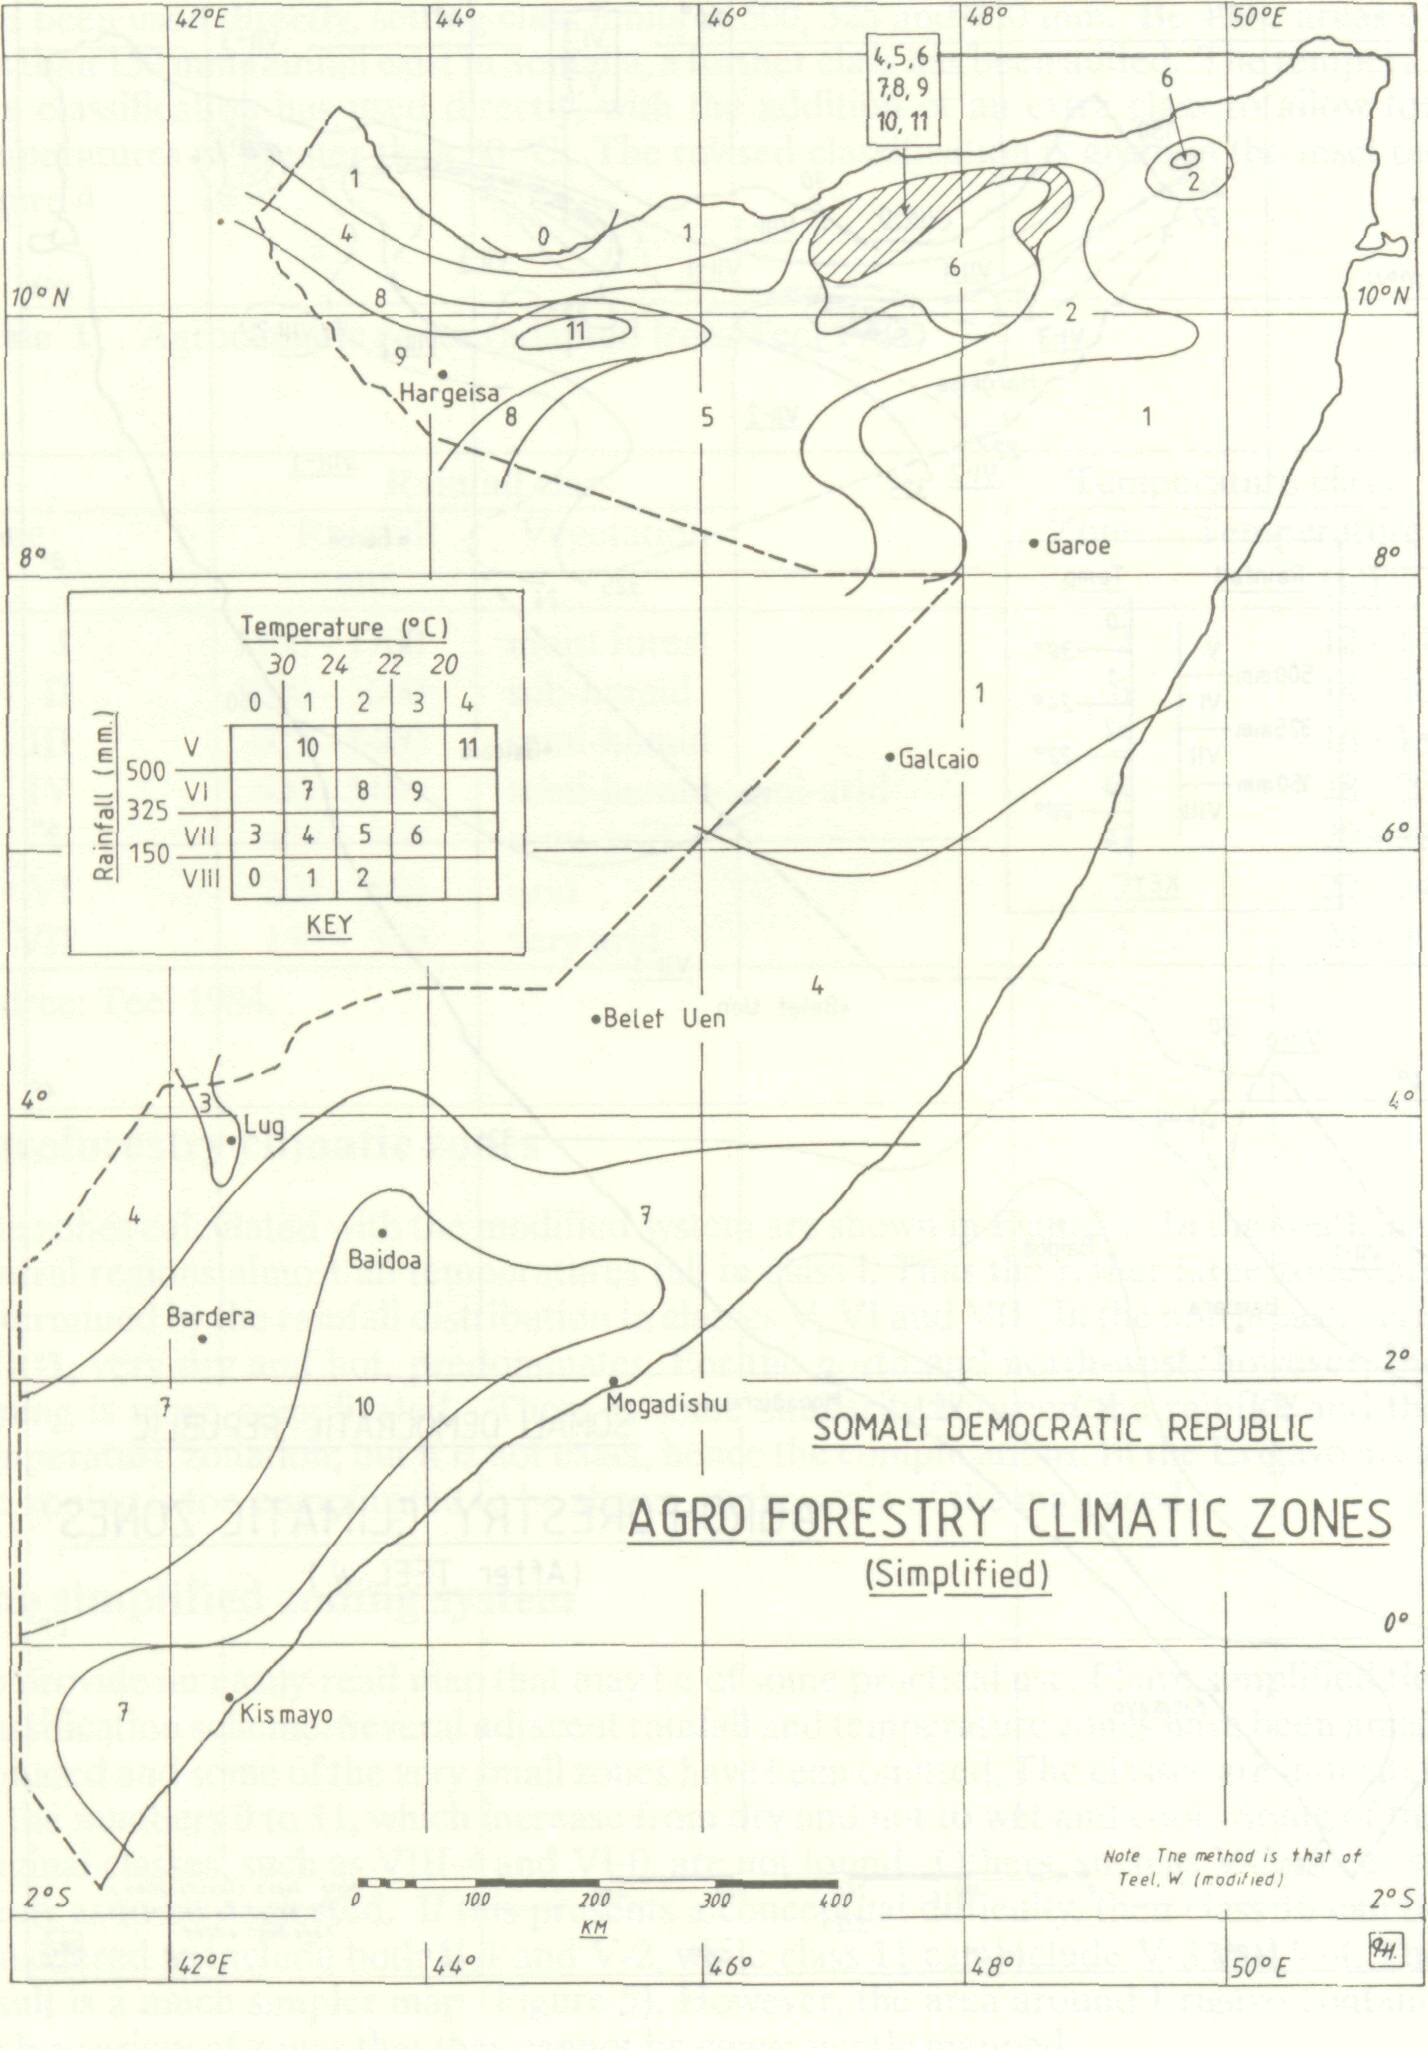
To provide an easily-read map that may be of some practical use, I have simplified the classification scheme. Several adjacent rainfall and temperature zones have been amalgamated and some of the very small zones have been omitted. The classes are indicated by the numbers 0 to 11, which increase from dry and hot to wet and cool. Some of the original classes, such as VIII-4 and VI-0, are not found. Others, such as V-2, occur so rarely as to be neglected. If this presents a conceptual difficulty, then class 10 can be considered to include both V-l and V-2, while class 11 can include V-3 and V-4. The result is a much simpler map (Figure 5). However, the area around Erigavo contains such a variety of zones that they cannot be conveniently mapped.
The next step should be that of confirming the validity of the zonation scheme by checking on the ground the occurrence of both native and exotic species of known climatic preferences. This would be a major study in itself. Although there is a considerable body of knowledge as to the extent of native species, this is not readily available, nor is there a complete list of the agroforestry uses of the native species. However, the need for this type of information is recognized, and some work is going ahead, principally at the National Range Agency. Until this is available, then some estimate of the potentialities and the availabilities of trees for agroforestry uses can be obtained by extrapolating information from adjacent countries, particularly Kenya.
This paper was prepared as a contribution of the Food Early Warning System Project, financed by the European Communities and executed by Transtec S.A., of Brussels. The cooperation and interest of the Director and staff of the Food Early Warning Department, Ministry of Agriculture, is appreciated. Desmond Mahoney, formerly of the British Forestry Project in Somalia assisted considerably in the work described.
British Meteorological Office. 1962. The Somali Republic and French Somaliland. Report IDCR61. London: British Meteorological Office. Fantoli, A. 1965. Contributo alia climatologia della Somalia. Rome: Min. Affari Esteri. Hunt, J A. 1951. A general survey of the Somaliland Protectorate, 1944-50. Hargeisa, So-malia: British Somaliland Administration. Teel, W. 1984. A pocket directory of trees and seeds in Kenya. Nairobi: Kengo. Webb, D.B., PJ. Wood, J.P. Smith and G.S. Henman. 1984. A guide to species selection for tropical and sub-tropical plantations. Tropical Forestry Papers No. 15. Oxford: Commonwealth Forestry Institute. |