![]()
An e-publication by the World Agroforestry Centre
METEOROLOGY AND AGROFORESTRY

|
|
An e-publication by the World Agroforestry Centre |
|
METEOROLOGY AND AGROFORESTRY |
|
|
Section 2 : Basic Principles The assessment of the stability of agroforestry systems J. Riley
O.D-A. Biometrics Liaison Officer Abstract Environmental data can provide useful information in a statistical analysis but only if the information is collected at meaningful time intervals. A statistical method to assess the stability of mixed species systems is described and its modification for use with perennial crops is considered.
The stability of intercropping systems has been considered by a number of research workers although published work on this subject is rare. A useful paper is by Rao and Willey (1980); a statistical paper reviewing the available assessment techniques and presenting a new approach is Mead et al. (1986). In this paper, I shall present and examine the concepts of this recent work and consider its extension for use with agroforestry systems. Most work that has involved the statistical assessment of stability has used variation, dependence upon environment, or risk to describe the degree of stability. The use of measures of variability such as the coefficient of variation assumes that 'stable' means unchanging or constant in return. This need not be so, for a farmer will surely not object to a large increase in yield provided his yields do not fall below a desirable minimum. However, the main fault with such an approach is that the structure of the data in terms of temporal or spatial differences is usually ignored which may give rise to spurious results. The idea of dependence upon environment rests upon the technique developed by Finlay and Wilkinson (1963). The success of this method depends largely upon the choice of the environmental index on which to regress the yields. In monocropping situations, the index is usually taken to be the mean yield of all the genotypes at that environment. In intercropping however, this means that the index is composed of the intercrop yield, and its two corresponding sole crop yields all of which are interdependent; any comparison of regressions based upon such indices will not be valid since the regressions will be interdependent. The risk approach to the assessment of stability has been used by Rao and Willey (1980) who examined sorghum and pigeonpea returns from different farming systems at a range of environments and related them to the minimum required levels of return thus producing estimates of risk. Although this method ignores the structure of the data it is well-defined and permits the idea of stability to be seen in a more realistic way.
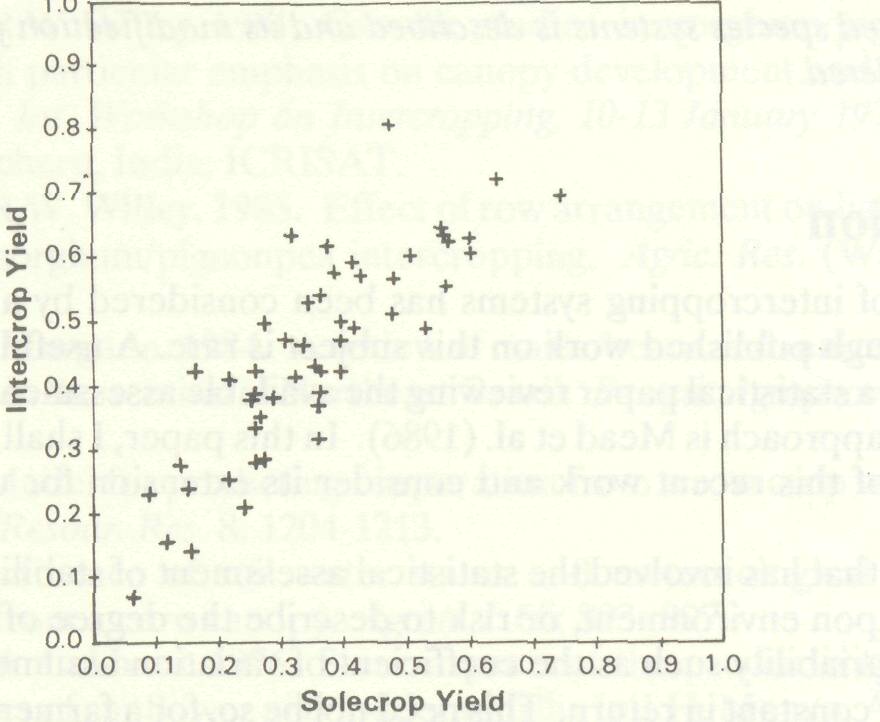
Mead et al. (1986) develop this risk approach allowing for the possibility of temporal and spatial components of variability in the data. Using a set of data consisting of sorghum/pigeonpea intercrop returns and sole sorghum returns, each from one of 51 site x year combinations, they examine the variation from site to site and from year to year for the 51 pairs of values, using bivariate analysis of variance. The patterns of variation for the site, year and interaction effects appear consistent so the data set is used as a whole. Still relying upon the idea of 'bivariates' the intercrop returns are plotted against the sole crop returns, as in Figure 1, and the overall scatter is considered in terms of a bivariate probability distribution.
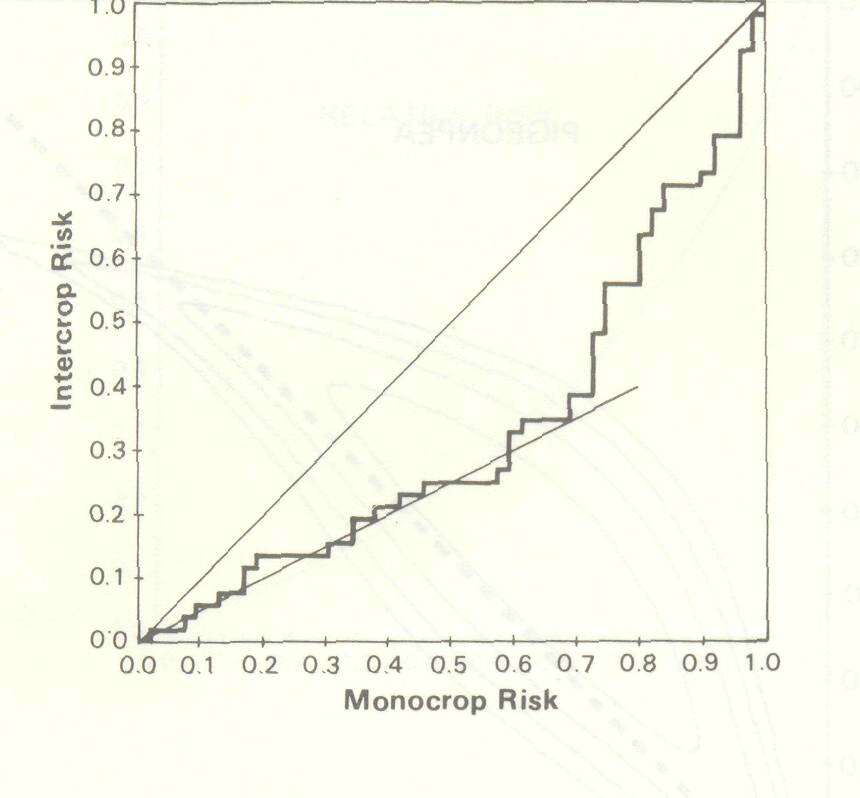
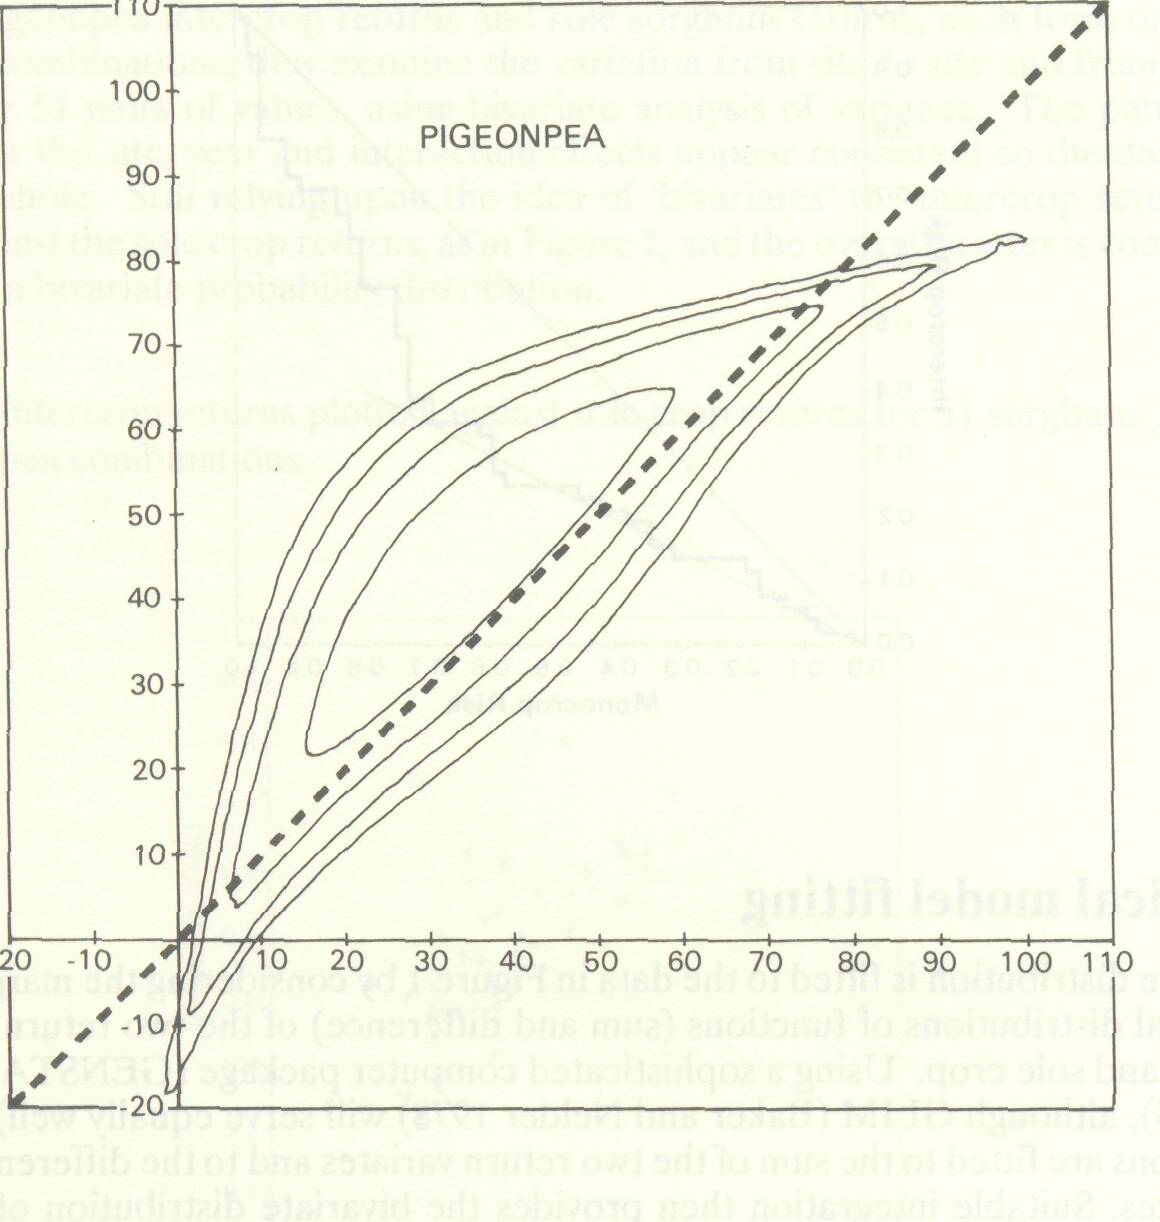
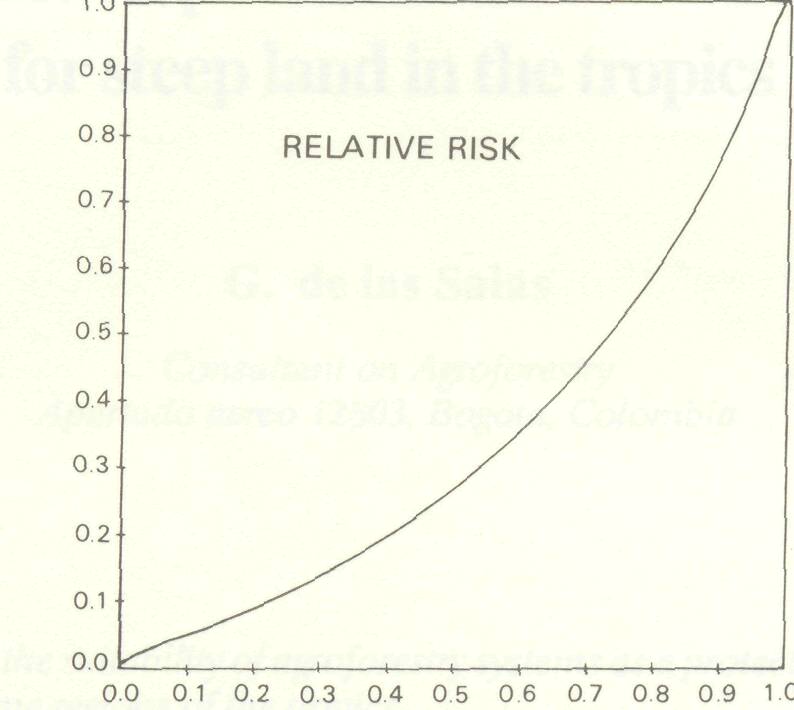
A bivariate distribution is fitted to the data in Figure 1 by considering the marginal and conditional distributions of functions (sum and difference) of the two return variates, intercrop and sole crop. Using a sophisticated computer package (GENSTAT (Alvey et al. 1983), although GLIM (Baker and Nelder 1978) will serve equally well), normal distributions are fitted to the sum of the two return variates and to the difference of the two variates. Suitable integration then provides the bivariate distribution of the two original variates. The contour plot for the fitted bivariate distribution is in Figure 3. Using this distribution the probability of the return for each system falling below any value can be calculated; these two sets of probabilities when plotted against each other give a smooth relative risk curve as in Figure 4. Note the similarities between Figures 1 and 3 and between Figures 2 and 4. This exercise, when repeated for intercrops of sorghum with cowpea, greengram, groundnut and soybean, showed for each crop that the intercrop was less risky than the sole crop system and that a good fit was obtained in the choice of bivariate distribution.
In the initial stages of data assessment it may be deduced that large variability exists from site to site or from year to year or from both sources. This will prohibit the use of the data set as a whole but can be dealt with in one or more of the following ways. The choice of sites, which may be a subset of the total number, should be made for the area for which recommendations are needed and only those sites included, provided the site-to-site variability is acceptable. Abnormal patterns of variability will be reflected in the residuals from the bivariate analysis of variance; adjustments to the data can be made on the basis of these residuals. Collection of environmental data such as altitude and soil type and climatic data such as rainfall and temperature can provide a possible -explanation for the variability and can also be used to adjust the data.
Agroforestry systems differ from intercropping with two (or more) annual species since the perennial component may exist for many years before providing the farmer with any return. The method can be used, however, for the following data sets:
Other situations can be identified for use of the method which can be tested for suitability by close examination of the data.
This work was prepared while the author was funded by the U.K. Overseas Development Administration.
Alvey, N.G. and 14 others. 1983. GENSTAT, a general statistical program. Harpenden: Rothamsted Experimental Station. Baker, RJ. and J.A. Nelder. 1978. The GLIM System, Generalised Linear Interactive Modelling. London: Royal Statistical Society. Finlay, K.W. and S.N. Wilkinson. 1963. The analysis of adaptation in plant breeding programmes. Aust J. Agric. Res. 14: 742-754. Mead, R., J. Riley, K.B.G. Dear and S.P. Singh. 1986. Stability comparison of intercropping and monocropping systems. Biometrics 42: 252-266. Rao, M.R. and R.W. Willey. 1980. Evaluation of yield stability in intercropping: studies on sorghum/pigeonpea. Exp. Agric. 16:105-116. |